
Page 224 - Special Topic Session (STS) - Volume 2
P. 224
STS486 R. Ayesha A. et al.
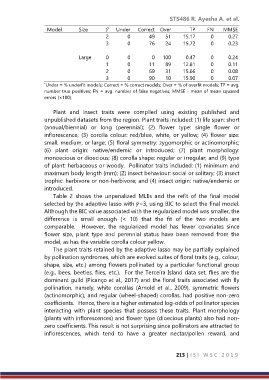
Model Size ̃ Under Correct Over TP FN MMSE
2 0 49 51 15.17 0 0.27
3 0 76 24 15.72 0 0.23
Large 0 0 0 100 0.47 0 0.24
1 0 11 89 12.81 0 0.11
2 0 69 31 15.66 0 0.08
3 0 90 10 15.90 0 0.07
* Under = % underfit models; Correct = % correct models; Over = % of overfit models; TP = avg.
number true positives; FN = avg. number of false negatives; MMSE - mean of mean squared
errors (×100).
Plant and insect traits were compiled using existing published and
unpublished datasets from the region. Plant traits included: (1) life span: short
(annual/biennial) or long (perennial); (2) flower type: single flower or
inflorescence; (3) corolla colour: red/blue, white, or yellow; (4) flower size:
small, medium, or large; (5) floral symmetry: zygomorphic or actinomorphic;
(6) plant origin: native/endemic or introduced; (7) plant morphology:
monoecious or dioecious; (8) corolla shape: regular or irregular; and (9) type
of plant: herbaceous or woody. Pollinator traits included: (1) minimum and
maximum body length (mm); (2) insect behaviour: social or solitary; (3) insect
trophic: herbivore or non-herbivore; and (4) insect origin: native/endemic or
introduced.
Table 2 shows the unpenalized MLEs and the refit of the final model
selected by the adaptive lasso with ̃=3, using BIC to select the final model.
Although the BIC value associated with the regularized model was smaller, the
difference is small enough (< 10) that the fit of the two models are
comparable. However, the regularized model has fewer covariates since
flower size, plant type and perennial status have been removed from the
model, as has the variable corolla colour yellow.
The plant traits retained by the adaptive lasso may be partially explained
by pollination syndromes, which are evolved suites of floral traits (e.g., colour,
shape, size, etc.) among flowers pollinated by a particular functional group
(e.g., bees, beetles, flies, etc.). For the Terceira Island data set, flies are the
dominant guild (Picanço et al., 2017) and the floral traits associated with fly
pollination, namely, white corollas (Arnold et al., 2009), symmetric flowers
(actinomorphic), and regular (wheel-shaped) corollas, had positive non-zero
coefficients. Hence, there is a higher estimated log-odds of pollinator species
interacting with plant species that possess these traits. Plant morphology
(plants with inflorescences) and flower type (dioecious plants) also had non-
zero coefficients. This result is not surprising since pollinators are attracted to
inflorescences, which tend to have a greater nectar/pollen reward, and
213 | I S I W S C 2 0 1 9