
Page 152 - Special Topic Session (STS) - Volume 4
P. 152
STS571 Ossi Nurmi et al.
The figure presents the number of outbound trips to each country based
on the Finnish Travel –survey as well as the upper and lower bounds of the
95% confidence interval for the survey estimates. The number of trips based
on MNO data is plotted against them as a line graph. Using this kind of
method, the MNO data provides a ‘second opinion’ to the survey confidence
intervals for each country. In case the MNO trips are outside of the confidence
interval for a certain country, the MNO data most likely includes serious
sources of over- or underestimation for that country. On the other hand, the
survey estimates also become rather useless if the 95% confidence interval is
too large. At present, countries with less than 170,000 trips have 95%
confidence interval limits of plus or minus 30 per cent. For most of such small
destination countries, the MNO trips can still provide a better estimate, given
that the MNO trips are within the confidence interval.
There are currently only 24 destination countries where the annual
estimates are considered reliable. On a monthly level, only trips to Estonia and
Sweden are mostly reliable. In total there are 9 million outbound trips to these
countries. The MNO data can potentially provide trips to 129 more smaller
destination countries with 1,5 million trips in total.
6. Discussion and Conclusion
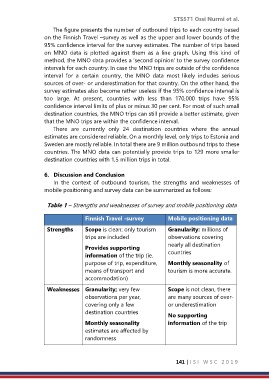
In the context of outbound tourism, the strengths and weaknesses of
mobile positioning and survey data can be summarized as follows:
Table 1 – Strengths and weaknesses of survey and mobile positioning data
Finnish Travel -survey Mobile positioning data
Strengths Scope is clean: only tourism Granularity: millions of
trips are included observations covering
Provides supporting nearly all destination
information of the trip (ie. countries
purpose of trip, expenditure, Monthly seasonality of
means of transport and tourism is more accurate.
accommodation)
Weaknesses Granularity; very few Scope is not clean, there
observations per year, are many sources of over-
covering only a few or underestimation
destination countries
No supporting
Monthly seasonality information of the trip
estimates are affected by
randomness
141 | I S I W S C 2 0 1 9