
Page 150 - Special Topic Session (STS) - Volume 4
P. 150
STS571 Ossi Nurmi et al.
There were 2.6 million trips to Estonia in 2017 according to Finnish travel
–survey. Using the top-down approach for mobile positioning data, 24% less
trips appear in MNO data. This indicates that this method underestimates
tourism to Estonia, as the 2.6 million trips from the survey is a very stable figure
with only small changes annually. In contrast, the outbound tourism to Sweden
comprises of only 2.0 million trips in the survey, while the top-down approach
estimates 44% more trips to Sweden in MNO data. The neighboring countries
with open land borders have many possible sources of overestimation such as
frequent non-tourism trips, border noise etc. There is yet another reliable data
source for providing the monthly seasonality of outbound trips to Estonia, the
main outbound tourism destination. Nearly all passengers to Estonia use one
of the ferries that operate between the capital cities of Helsinki and Tallinn.
The Finnish Transport Agency compiles statistics on the total monthly
passengers departing to Estonia, including passengers of all nationalities.
14 %
13 %
12 %
11 %
10 %
9 %
8 %
7 %
6 %
5 %
4 %
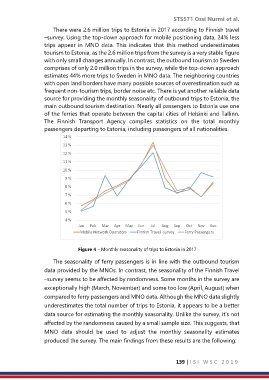
Jan Feb Mar Apr May Jun Jul Aug Sep Oct Nov Dec
Mobile Network Operators Finnish Travel -survey Ferry Passengers
Figure 4 – Monthly seasonality of trips to Estonia in 2017
The seasonality of ferry passengers is in line with the outbound tourism
data provided by the MNOs. In contrast, the seasonality of the Finnish Travel
–survey seems to be affected by randomness. Some months in the survey are
exceptionally high (March, November) and some too low (April, August) when
compared to ferry passengers and MNO data. Although the MNO data slightly
underestimates the total number of trips to Estonia, it appears to be a better
data source for estimating the monthly seasonality. Unlike the survey, it’s not
affected by the randomness caused by a small sample size. This suggests, that
MNO data should be used to adjust the monthly seasonality estimates
produced the survey. The main findings from these results are the following:
139 | I S I W S C 2 0 1 9