
Page 151 - Special Topic Session (STS) - Volume 4
P. 151
STS571 Ossi Nurmi et al.
1. The data from two different operators are highly correlated. The
monthly seasonality is nearly identical and in line with outbound
tourism based on Finnish Travel –survey.
2. Depending on country of destination, the top-down approach
dramatically over- or underestimates the total number of
outbound tourism trips to that country. There are many known
sources of bias in mobile data: non-tourism trips, border noise,
devices switched off, multiple devices, transit corridors, conceptual
differences etc.
3. Mobile positioning data provides a better estimate on the monthly
seasonality of outbound tourism. The monthly estimates of Finnish
Travel -survey are affected by randomness due to small sample
size.
5. Results: Country specific estimation
How should the survey data be enriched or recalibrated using MNO data
in order to improve the accuracy? The proposed method for recalibrating the
outbound trips data has to provide at least the following estimations:
1. Annual number of all outbound trips
2. Monthly seasonality of outbound trips to each country
3. Annual number of outbound trips to each country
4. Year-on-year change in the number of outbound trips
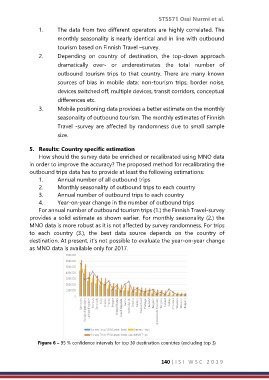
For annual number of outbound tourism trips (1.) the Finnish Travel-survey
provides a solid estimate as shown earlier. For monthly seasonality (2.) the
MNO data is more robust as it is not affected by survey randomness. For trips
to each country (3.), the best data source depends on the country of
destination. At present, it’s not possible to evaluate the year-on-year change
as MNO data is available only for 2017.
Figure 6 – 95 % confidence intervals for top 30 destination countries (excluding top 3)
140 | I S I W S C 2 0 1 9