
Page 293 - Special Topic Session (STS) - Volume 4
P. 293
STS587 Guangwu C.
demand-side system represents the the sectoral digitalised effects on total
output throughout all the supply chain system associating with one unit of
final demand in sectors.
3. Results
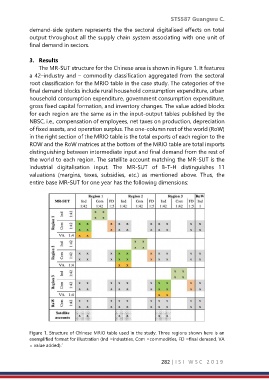
The MR-SUT structure for the Chinese area is shown in Figure 1. It features
a 42–industry and – commodity classification aggregated from the sectoral
root classification for the MRIO table in the case study. The categories of the
final demand blocks include rural household consumption expenditure, urban
household consumption expenditure, government consumption expenditure,
gross fixed capital formation, and inventory changes. The value added blocks
for each region are the same as in the input-output tables published by the
NBSC, i.e., compensation of employees, net taxes on production, depreciation
of fixed assets, and operation surplus. The one-column rest of the world (RoW)
in the right section of the MRIO table is the total exports of each region to the
ROW and the RoW matrices at the bottom of the MRIO table are total imports
distinguishing between intermediate input and final demand from the rest of
the world to each region. The satellite account matching the MR-SUT is the
industrial digitalisation input. The MR-SUT of B-T-H distinguishes 11
valuations (margins, taxes, subsidies, etc.) as mentioned above. Thus, the
entire base MR-SUT for one year has the following dimensions:
Figure 1. Structure of Chinese MRIO table used in the study. Three regions shown here is an
exemplified format for illustration (Ind =industries, Com =commodities, FD =final demand, VA
= value added).’
282 | I S I W S C 2 0 1 9