Page 396 - Special Topic Session (STS) - Volume 4
P. 396
STS2320 Ali S. H.
                  violations of the expected norm can have a severe influence on the computed
                  index numbers as they maylead to biased index values.
                      The rest of this paper is organized as follows: Sections 2 and 3 discuss ways
                  of identifying and treating the above mentioned violations. Section 4 discusses
                  what to do with the outliers once they are identified.

                  2.  The Univariate Approach
                      Each variable in a composite index data should be examined individually
                  for  the  presence  of  skewness,  kurtosis,  and/or  the  presence  of  univariate
                  outliers before the composite index is computed.

                  2.1 Skewness and Kurtosis
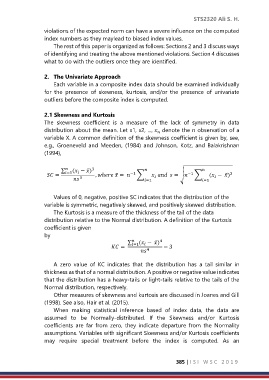
                  The  skewness  coefficient  is  a  measure  of  the  lack  of  symmetry  in  data
                  distribution about the mean. Let x1, x2, ...,   denote the n observation of a

                  variable X. A common definition of the skewness coefficient is given by, see,
                  e.g.,  Groeneveld  and  Meeden,  (1984)  and  Johnson,  Kotz,  and  Balakrishnan
                  (1994),

                        ∑   ( − ̅) 3
                    =  =1     , ℎ ̅ =  −1  ∑       = √ −1  ∑  ( − ̅) 2


                              3                     =1                   =1

                      Values of 0, negative, positive SC indicates that the distribution of the
                  variable is symmetric, negatively skewed, and positively skewed distribution.
                      The Kurtosis is a measure of the thickness of the tail of the data
                  distribution relative to the Normal distribution. A definition of the Kurtosis
                  coefficient is given
                  bytrialalallalalllalaaaaaaaaaaaaaaaaaaaaaaaaaaaaaaaaaaaaaaaaaalalallal
                                                  ∑   ( − ̅) 4
                                             =   =1     − 3
                                                        4

                      A  zero  value  of  KC  indicates  that  the  distribution  has  a  tail  similar  in
                  thickness as that of a normal distribution. A positive or negative value indicates
                  that the distribution has a heavy-tails or light-tails relative to the tails of the
                  Normal distribution, respectively.
                      Other measures of skewness and kurtosis are discussed in Joanes and Gill
                  (1998). See also, Hair et al. (2015).
                      When  making  statistical  inference  based  of  index  data,  the  data  are
                  assumed  to  be  Normally-distributed.  If  the  Skewness  and/or  Kurtosis
                  coefficients  are  far  from  zero,  they  indicate  departure  from  the  Normality
                  assumptions. Variables with significant Skewness and/or Kurtosis coefficients
                  may  require  special  treatment  before  the  index  is  computed.  As  an


                                                                     385 | I S I   W S C   2 0 1 9

