
Page 398 - Special Topic Session (STS) - Volume 4
P. 398
STS2320 Ali S. H.
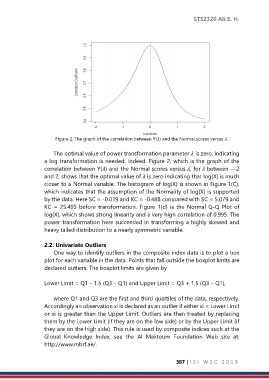
Figure 2. The graph of the correlation between Y() and the Normal scores versus .
The optimal value of power transformation parameter is zero, indicating
a log transformation is needed. Indeed. Figure 2, which is the graph of the
correlation between Y() and the Normal scores versus , for between —2
and 2, shows that the optimal value of is zero indicating that log(X) is much
closer to a Normal variable. The histogram of log(X) is shown in Figure 1(C),
which indicates that the assumption of the Normality of log(X) is supported
by the data. Here SC = -0.019 and KC = -0.488 compared with SC = 5.079 and
KC = 25.495 before transformation. Figure 1(d) is the Normal Q-Q Plot of
log(X), which shows strong linearity and a very high correlation of 0.995. The
power transformation here succeeded in transforming a highly skewed and
heavy tailed distribution to a nearly symmetric variable.
2.2. Univariate Outliers
One way to identify outliers in the composite index data is to plot a box
plot for each variable in the data. Points that fall outside the boxplot limits are
declared outliers. The boxplot limits are given by
Lower Limit = Q1 – 1.5 (Q3 – Q1) and Upper Limit = Q3 + 1.5 (Q3 – Q1),
where Q1 and Q3 are the first and third quartiles of the data, respectively.
Accordingly an observation xi is declared as an outlier if either xi < Lower Limit
or xi is greater than the Upper Limit. Outliers are then treated by replacing
them by the Lower Limit (if they are on the low side) or by the Upper Limit (if
they are on the high side). This rule is used by composite indices such at the
Global Knowledge Index; see the Al Maktoum Foundation Web site at:
http://www.mbrf.ae/.
387 | I S I W S C 2 0 1 9