
Page 401 - Special Topic Session (STS) - Volume 4
P. 401
STS2320 Ali S. H.
the computation of the index numbers. In this article, we discussed methods
for editing the data that deal with these problems.
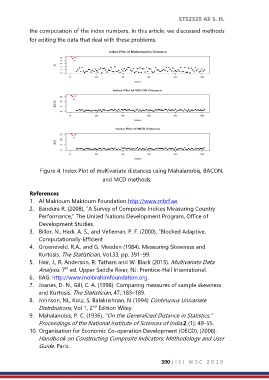
Figure 4. Index Plot of multivariate distances using Mahalanobis, BACON,
and MCD methods.
References
1. Al Maktoum Maktoum Foundation http://www.mbrf.ae.
2. Bandura R. (2008), “A Survey of Composite Indices Measuring Country
Performance,” The United Nations Development Program, Office of
Development Studies.
3. Billor, N., Hadi, A. S., and Velleman, P. F. (2000), “Blocked Adaptive,
Computationally-Efficient
4. Groeneveld, R.A., and G. Meeden (1984). Measuring Skewness and
Kurtosis. The Statistician, Vol.33, pp. 391–99.
5. Hair, J., R. Anderson, R. Tatham and W. Black (2015). Multivariate Data
th
Analysis. 7 ed. Upper Saddle River, NJ: Prentice-Hall International.
6. IIAG: http://www.moibrahimfoundation.org.
7. Joanes, D. N., Gill, C. A. (1998): Comparing measures of sample skewness
and Kurtosis. The Statistician, 47, 183–189.
8. Johnson, NL, Kotz, S, Balakrishnan, N (1994) Continuous Univariate
Distributions, Vol 1, 2 Edition Wiley.
nd
9. Mahalanobis, P. C. (1936), “On the Generalized Distance in Statistics,”
Proceedings of the National Institute of Sciences of India.2 (1): 49–55.
10. Organisation for Economic Co-operation Development (OECD), (2008).
Handbook on Constructing Composite Indicators: Methodology and User
Guide. Paris.
390 | I S I W S C 2 0 1 9