
Page 232 - Contributed Paper Session (CPS) - Volume 2
P. 232
CPS1844 Reza M.
Suppose ℤ = { } is a third group of observations and define the ECDFs
=1
similar with equations (1).
of () , () , and ()
Example 3 We consider the Iris dataset where four characteristic are measured
on three species of Iris plant. The data contains observations on sepal length,
sepal width, petal length, and petal width of Iris Setosa X, Iris Versicolor Y, and
Iris Z . There are 50 observations per group. Is there evidence that the mean
vectors are significantly different across the 3 species? A MANOVA test rejects
the equality of the mean vectors and we have strong evidence that the mean
vectors differ across the 3 species. Is there evidence that the covariance
matrices are significantly different across the 3 species? Box’s M-test rejects
the hypothesis of the homogeneity of covariance matrices. Bivariate plots of
petal and sepal length and width show that while Setosa species are distinctly
different from Versicolor and Virginica, the two species Virginica and
Versicolor cannot easily be separated.
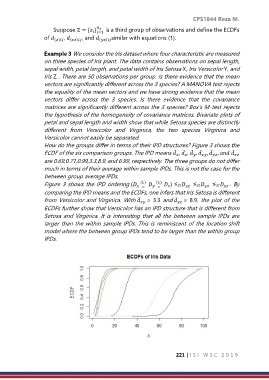
How do the groups differ in terms of their IPD structures? Figure 3 shows the
ECDF of the six comparison groups. The IPD means , , , , ,
are 0.69,0.71,0.99,3.3,8.9, and 6.99, respectively. The three groups do not differ
much in terms of their average within sample IPDs. This is not the case for the
between group average IPDs.
()
()
Figure 3 shows the IPD ordering ( = = ) ≤St ≤St ≤St . By
comparing the IPD means and the ECDFs, one infers that Iris Setosa is different
from Versicolor and Virginica. With = 3.3 and = 8.9, the plot of the
ECDFs further show that Versicolor has an IPD structure that is different from
Setosa and Virginica. It is interesting that all the between sample IPDs are
larger than the within sample IPDs. This is reminiscent of the location shift
model where the between group IPDs tend to be larger than the within group
IPDs.
221 | I S I W S C 2 0 1 9