
Page 233 - Contributed Paper Session (CPS) - Volume 2
P. 233
CPS1844 Reza M.
Figure 3: Empirical CDFs of sample IPDs for Iris data. From top to bottom, the
ECDFs are (red), (brown), (green) grouped together followed by the
̂
̂
̂
̂
̂
̂
ECDFs of (blue), (pink) and (black).
Example 4 We consider the wine data set (Asuncion and Newman, 2007),
which contains 178 rows of data on concentrations of 13 different chemicals
in wines grown in the same region in Italy. The wine types are from three
cultivars of grapes: Barolo, Grignolino, and Barbera. There are 59, 71, and 48
observations on each type of wine. Barolo wine is made from Nebbiolo grapes,
the other two wines have the name of the grapes from which they are made.
Univariate analysis shows that the wine measurements have very different
scales and the three wine types are well-separated. Barolo wines contain
distinctly higher amounts of Proline than wines from either Barbera or
Gringnolino.
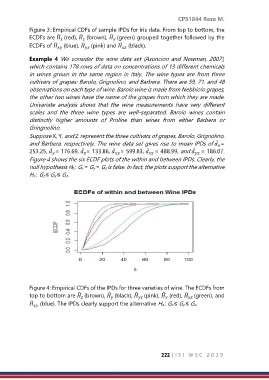
Suppose X, Y, and Z represent the three cultivars of grapes, Barolo, Grignolino,
and Barbera, respectively. The wine data set gives rise to mean IPDs of =
253.25, = 176.69, = 133.86, = 599.83, = 488.99, and = 186.07.
Figure 4 shows the six ECDF plots of the within and between IPDs. Clearly, the
null hypothesis H0 : Gx = Gy = Gz is false. In fact, the plots support the alternative
Ha : Gz ≤ Gy ≤ Gz.
Figure 4: Empirical CDFs of the IPDs for three varieties of wine. The ECDFs from
̂
̂
̂
̂
̂
top to bottom are (brown), (black), (pink), (red), (green), and
(blue). The IPDs clearly support the alternative Ha : Gz ≤ Gy ≤ Gz.
̂
222 | I S I W S C 2 0 1 9