
Page 275 - Contributed Paper Session (CPS) - Volume 2
P. 275
CPS1855 Nobutane H.
groups as shown in the Figure 1. However, the rates for 75-79 and those for
50-54 have a different trend after 2000-14 as seen in the Figure 2.
Such trend in breast cancer death rates for Japanese women aged 50 and
over might be because age factors and socio-economic factors (Lagerlund, et
al, 2005) intricately affect Japanese women. For example, we consider the age
factor associated with that most invasive breast cancers are found in women
55 years and older. On the other hand, the socio-economic factors are
associated, for example, with westernized food culture, low fertility, increase
of working women and increasing of woman’s first pregnancy over 40. In
addition, also incorporation of mammography to public health check is also
considered as socio-economic factors. So our aim in this study is to propose a
statistical model for decomposing data given by age and period for breast
cancer deaths into age and socio-economic factors. And the second aim is to
apply the proposed model to actual data for Japanese females. From the result
of fitting the proposed mode, it is found that there exist environmental effects
on the numbers of breast cancer deaths associated our westernized food
culture or low fertility or increase of the number of working women or increase
of the number of pregnancies over 40 years old or incorporation of
mammography.
The proposed model can be applied to data given by the same format, that
is, age-by-period data. Because of that, we can compare trends in environment
effects estimated from data for people’s traits or features. In the discussion
part of this article, we focused on breast cancer and food preferences, and
show the result of analysing causal relations between the food preferences
and breast cancer based on estimated environment effects for breast cancer
and food preferences.
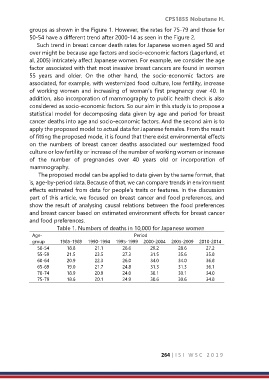
Table 1. Numbers of deaths in 10,000 for Japanese women
Age- Period
group 1985-1989 1990-1994 1995-1999 2000-2004 2005-2009 2010-2014
50-54 18.8 21.1 26.6 29.2 28.6 27.2
55-59 21.5 23.5 27.3 31.5 35.6 35.8
60-64 20.9 22.3 26.0 34.0 34.0 36.8
65-69 19.0 21.7 24.8 31.3 31.3 36.1
70-74 18.9 20.9 24.0 30.1 30.1 34.0
75-79 18.6 20.1 24.9 30.6 30.6 34.8
264 | I S I W S C 2 0 1 9