
Page 277 - Contributed Paper Session (CPS) - Volume 2
P. 277
CPS1855 Nobutane H.
it is impossible to observe , it is conventionally approximated by sum of
survivors every year in [ −1 , ), which is called person-years.
For analysing data given by age and period, the age-period-cohort model
(Kupper et al., 1985) has enjoyed considerable popularity. The age-period-
cohort model is one expressed as this formula.
log = + + + − (1)
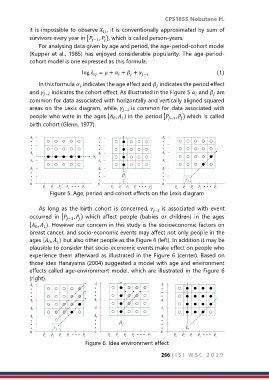
In this formula indicates the age effect and indicates the period effect
and − indicates the cohort effect. As illustrated in the Figure 5 and are
common for data associated with horizontally and vertically aligned squared
areas on the Lexis diagram, while, − is common for data associated with
people who were in the ages [ , ) in the period [ −1 , ) which is called
1
0
birth cohort (Glenn, 1977).
Figure 5. Age, period and cohort effects on the Lexis diagram
As long as the birth cohort is concerned, − is associated with event
occurred in [ −1 , ) which affect people (babies or children) in the ages
[ , ). However our concern in this study is the socioeconomic factors on
0
1
breast cancer, and socio-economic events may affect not only people in the
ages [ , ) but also other people as the Figure 6 (left). In addition it may be
1
0
plausible to consider that socio-economic events make effect on people who
experience them afterward as illustrated in the Figure 6 (center). Based on
those idea Hanayama (2004) suggested a model with age and environment
effects called age-environment model, which are illustrated in the Figure 6
(right).
Figure 6. Idea environment effect
266 | I S I W S C 2 0 1 9