
Page 278 - Contributed Paper Session (CPS) - Volume 2
P. 278
CPS1855 Nobutane H.
The age-environment model is expressed as follows.
−1
log = + + ∑ , (2)
=−− 0 /5
where is the age effect, which is common for the age-period-cohort model,
and is the environment effect associated with events occurred in [ −1 , ),
which affect all people who experience them. Because people who are alive in
the period [ −1 , ) in the ages [ −1 , ) are affected all events occurred
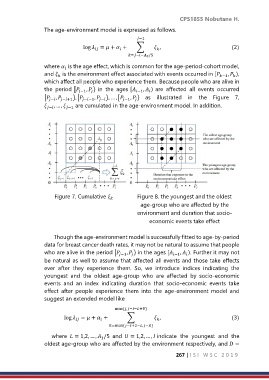
[ − , −+1 ), [ −−1 , − ), … , [ −1 , ) as illustrated in the Figure 7,
− , … , −1 are cumulated in the age-environment model. In addition.
Figure 7. Cumulative Figure 8. the youngest and the oldest
age-group who are affected by the
environment and duration that socio-
economic events take effect
Though the age-environment model is successfully fitted to age-by-period
data for breast cancer death rates, it may not be natural to assume that people
who are alive in the period [ −1 , ) in the ages [ −1 , ). Further it may not
be natural as well to assume that affected all events and those take effects
ever after they experience them. So, we introduce indices indicating the
youngest and the oldest age-group who are affected by socio-economic
events and an index indicating duration that socio-economic events take
effect after people experience them into the age-environment model and
suggest an extended model like
min (,−−+)
log = + + ∑ , (3)
=max{−+2−,−}
where = 1,2, … , /5 and = 1,2, … , indicate the youngest and the
1
oldest age-group who are affected by the environment respectively, and =
267 | I S I W S C 2 0 1 9