
Page 284 - Contributed Paper Session (CPS) - Volume 2
P. 284
CPS1857 Nicholas J. et al.
This paper proposes a simple least median of squares regression algorithm
to performa a high performance computation for classifying land types and
mapping the land-use changes. The least median square of regression is a
method for estimating the regression models that works by minimizing the
median value of the squares error of an observation [2]. The method is suitable
for data with outliers [2]. The least median of squares regression method will
produce the regression models for each land type. The response of the model
are the limited multi-dependent variables associated with the category of land
types. A limited dependent variable is defined as a dependent variable whose
range in substantively restricted [1].
The outcome of the training process is the four regression models
associated with the four land types category (impervious, green, water, and
soil land). These models are used in the mapping process where all the pixels
of the Landsat 8 bands data will be calculated by regression models for each
land type. The land classification result will be represented in a thematic map.
This map shows the land-use changes detected in the Jabodetabek area for
an annual observation of the changes.
The good performance of the regression models will produces a good
land-use change mapping. The land-use change mapping of the Jabodetabek
megacities illustrates the real condition in the area. Regarding the evaluation,
the least median squares of squares regression is found to be a simple and
realiable method that can be considered for classifying and mapping the land-
use changes from the Landsat satellite imagery.
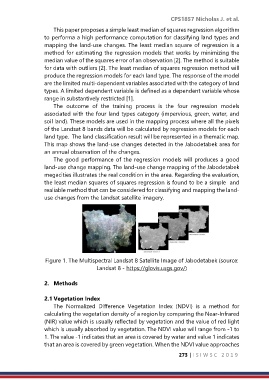
Figure 1. The Multispectral Landsat 8 Satellite Image of Jabodetabek (source:
Landsat 8 - https://glovis.usgs.gov/)
2. Methods
2.1 Vegetation Index
The Normalized Difference Vegetation Index (NDVI) is a method for
calculating the vegetation density of a region by comparing the Near-Infrared
(NIR) value which is usually reflected by vegetation and the value of red light
which is usually absorbed by vegetation. The NDVI value will range from -1 to
1. The value -1 indicates that an area is covered by water and value 1 indicates
that an area is covered by green vegetation. When the NDVI value approaches
273 | I S I W S C 2 0 1 9