Page 286 - Contributed Paper Session (CPS) - Volume 2
P. 286

CPS1857 Nicholas J. et al.
                      regression models for the i-th observation (i = 1, 2, ..., n), p-varieties, and
                      the j-land types categorical (j = {1, 2, 3, 4}) in every subset, which can be
                      formulated as:
                                        =    +   + ⋯ +                    (4)
                                       ⃗
                                                                   
                                        
                                              1 1
                                                      2 2
                      The  estimator  of  regression  coefficient  for  the  j-land  types  can  be
                      formulated as:
                                               = ( ) (′)                      (5)
                                              ⃗
                                                             ⃗
                                                        −1
                                                     ′
                                               
                                                              
                      where
                                          11   21  …   1          1
                                          12   22  …   2         
                                                                   ⃗
                                     = [  ⋮   ⋮        ⋱  ⋮  ] ;    and  = [  ⋮ 2 ]
                                          1   2  …          
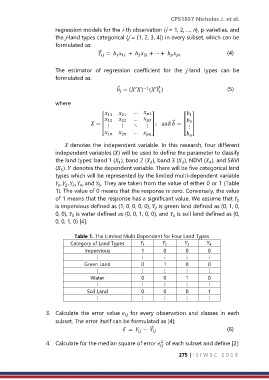
                           denotes the independent variable. In this research, four different
                      independent variables () will be used to define the parameter to classify
                      the land types: band 1 ( ), band 2 ( ), band 3 ( ), NDVI ( ), and SAVI
                                                                       3
                                              1
                                                           2
                                                                                 4
                      ( ).  denotes the dependent variable. There will be five categorical land
                        5
                      types which will be represented by the limited multi-dependent variable
                       ,  ,  ,  , and  . They are taken from the value of either 0 or 1 (Table
                       1
                                       5
                          2
                                4
                             3
                      1). The value of 0 means that the response is zero. Conversely, the value
                      of 1 means that the response has a significant value. We assume that 
                                                                                            1
                      is impervious defined as (1, 0, 0, 0, 0),   is green land defined as (0, 1, 0,
                                                            2
                      0, 0),   is water defined as (0, 0, 1, 0, 0), and   is soil land defined as (0,
                                                                   4
                             3
                      0, 0, 1, 0) [4].

                              Table 1. The Limited Multi Dependent for Four Land Types
                            Category of Land Types                        
                                                                                 4
                                                        1
                                                                         3
                                                                2
                                  Impervious           1        0       0        0
                                      ⋮                ⋮        ⋮        ⋮       ⋮
                                 Green Land            0        1       0        0
                                      ⋮                ⋮        ⋮        ⋮       ⋮
                                    Water              0        0       1        0
                                      ⋮                ⋮        ⋮        ⋮       ⋮
                                  Soil Land            0        0       0        1
                                      ⋮                ⋮        ⋮        ⋮       ⋮

                   3.  Calculate  the  error  value   for  every  observation  and  classes  in  each
                                                 
                      subset. The error itself can be formulated as [4]:
                                                  =  −                            (6)
                                                           ⃗
                                                      
                                                            
                   4.  Calculate for the median square of error   of each subset and define [2]:
                                                               2
                                                              
                                                                      275 | I S I W S C   2 0 1 9
   281   282   283   284   285   286   287   288   289   290   291