
Page 289 - Contributed Paper Session (CPS) - Volume 2
P. 289
CPS1857 Nicholas J. et al.
output of the regression models ( ; ; ; ). The pixel is
classified as the impervious land if () produces the largest value among
the regression models.
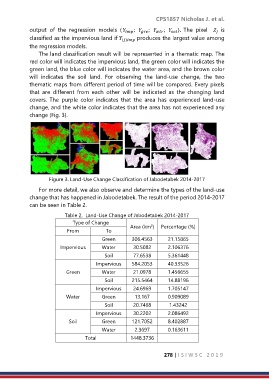
The land classification result will be represented in a thematic map. The
red color will indicates the impervious land, the green color will indicates the
green land, the blue color will indicates the water area, and the brown color
will indicates the soil land. For observing the land-use change, the two
thematic maps from different period of time will be compared. Every pixels
that are different from each other will be indicated as the changing land
covers. The purple color indicates that the area has experienced land-use
change, and the white color indicates that the area has not experienced any
change (Fig. 3).
Figure 3. Land-Use Change Classification of Jabodetabek 2014-2017
For more detail, we also observe and determine the types of the land-use
change that has happened in Jabodetabek. The result of the period 2014-2017
can be seen in Table 2.
Table 2. Land-Use Change of Jabodetabek 2014-2017
Type of Change 2
From To Area (km ) Percentage (%)
Green 306.4563 21.15865
Impervious Water 30.5082 2.106376
Soil 77.6538 5.361448
Impervious 584.2053 40.33526
Green Water 21.0978 1.456655
Soil 215.5464 14.88196
Impervious 24.6969 1.705147
Water Green 13.167 0.909089
Soil 20.7468 1.43242
Impervious 30.2202 2.086492
Soil Green 121.7052 8.402887
Water 2.3697 0.163611
Total 1448.3736
278 | I S I W S C 2 0 1 9