Page 288 - Contributed Paper Session (CPS) - Volume 2
P. 288

CPS1857 Nicholas J. et al.
                  3.  Result
                  3.1 The Training Process
                      The training data are acquired from the Landsat 8 satellite imagery and
                  consist of pixels of the impervious, green, water, and soil land. We obtain the
                  data by looking through the coordinates of the location of each land types
                  using  the  Google  Earth.  The  pixels  of  the  location  of  each  land  types  are
                  located  in  the  Landsat  8  images  by  cropping  the  longitude  and  latitude
                  coordinates of the coresponding area. The cropped images of each land types
                  will be used as the training data (input). The regression model using the limited
                  dependent variable  will be estimated based on the robust subsample n. The
                  model estimation cannot be interpreted as the change in response y given
                  one unit increased of   because of   ∈ {1,0}. The outcome of the training
                                         
                  process is four regression models of four land types, i.e.    for impervious,
                     for green,    for water, and   for soil land.
                                                    
                           = −0.2879 + 0.0012   + 0.0105   – 0.0081   + 598.2345       (13)
                                                1
                                                                      3
                                                           2
                                              − 400.127 
                                               4
                                                           5
                            =  0.7005 + 0.0109   – 0.0112   – 0.0013   – 38.0647       (14)
                                                           2
                                                                      3
                                                1
                                              + 25.9631 
                                               4
                                                           5
                           = −0.0496 + 0.0002   – 0.0002   + 0.0003   – 332.0284       (15)
                                                           2
                                                                      3
                                                1
                                              + 221.7376 
                                              4
                                                           5
                           =  0.595 – 0.0172   + 0.0068   + 0.0082   – 262.6767  +      (16)
                                                                  3
                                                                              4
                                                       2
                                            1
                                               175.4784 
                                                         5
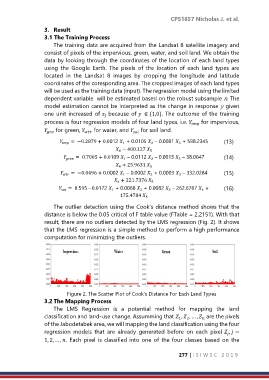
                      The outlier detection using the Cook’s distance method shows that the
                  distance is below the 0.05 critical of F table value (FTable = 2.2151). With that
                  result, there are no outliers detected by the LMS regression (Fig. 2). It shows
                  that the LMS regression is a simple method to perform a high performance
                  computation for minimizing the outliers.


                           Figure 2. The Scatter Plot of Cook’s Distance For Each Land Types
                  3.2 The Mapping Process
                      The  LMS  Regression  is  a  potential  method  for  mapping  the  land
                  classification and land-use change. Assumming that  ,  , … ,   are the pixels
                                                                      1
                                                                               
                                                                         2
                  of the Jabodetabek area, we will mapping the land classification using the four
                  regression  models  that  are  already  generated  before  on  each  pixel  ,  =
                                                                                        
                  1, 2, … , . Each pixel is classified into one of the four classes based on the
                                                                      277 | I S I W S C   2 0 1 9
   283   284   285   286   287   288   289   290   291   292   293