
Page 335 - Contributed Paper Session (CPS) - Volume 2
P. 335
CPS1876 Sarbojit R. et al.
estimated misclassification probabilities of the different classifiers. The
misclassification probabilities were computed for a set of increasing values of
, namely, 5, 10, 50, 100, 250, 500 and 1000 for Example 1 and 2, and
50, 100, 250, 500 and 1000 for Examples 3-4.
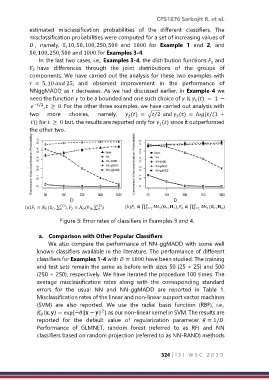
In the last two cases, i.e., Examples 3-4, the distribution functions and
1
have differences through the joint distributions of the groups of
2
components. We have carried out the analysis for these two examples with
= 5, 10 25, and observed improvement in the performance of
NNggMADD as r decreases. As we had discussed earlier, in Example 4 we
need the function to be a bounded and one such choice of is () = 1 −
1
−/2 , ≥ 0. For the other three examples, we have carried out analysis with
two more choices, namely, () = √/2 and () = (/(1 +
3
2
)) for ≥ 0 but, the results are reported only for () since it outperformed
1
the other two.
D D
(1) (2) 1 ( , 2 )
() 1 ≡ (0 , ∑ ), 2 ≡ (0 , ∑ ) () 1 ≡ ∏ =1 1 ( , 1 ), 2 ≡ ∏ =1
Figure 3: Error rates of classifiers in Examples 3 and 4.
a. Comparison with Other Popular Classifiers
We also compare the performance of NN-ggMADD with some well
known classifiers available in the literature. The performance of different
classifiers for Examples 1-4 with = 1000 have been studied. The training
and test sets remain the same as before with sizes 50 (25 + 25) and 500
(250 + 250), respectively. We have iterated the procedure 100 times. The
average misclassification rates along with the corresponding standard
errors for the usual NN and NN-ggMADD are reported in Table 1.
Misclassification rates of the linear and non-linear support vector machines
(SVM) are also reported. We use the radial basis function (RBF), i.e.,
(, ) = exp {−‖ − ‖ } as our non-linear kernel in SVM. The results are
2
reported for the default value of regularization parameter = 1/.
Performance of GLMNET, random forest (referred to as RF) and NN
classifiers based on random projection (referred to as NN-RAND) methods
324 | I S I W S C 2 0 1 9