
Page 34 - Contributed Paper Session (CPS) - Volume 2
P. 34
CPS1409 Rahma F.
Figure 2 Histogram of Euclidian Distance between Regencies/Cities in East Java
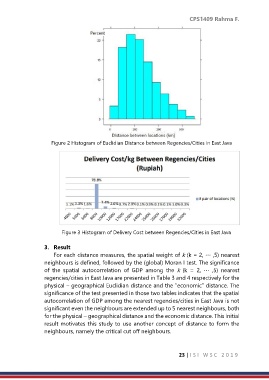
Figure 3 Histogram of Delivery Cost between Regencies/Cities in East Java
3. Result
For each distance measures, the spatial weight of k (k = 2, ⋯ ,5) nearest
neighbours is defined, followed by the (global) Moran I test. The significance
of the spatial autocorrelation of GDP among the k (k = 2, ⋯ ,5) nearest
regencies/cities in East Java are presented in Table 3 and 4 respectively for the
physical – geographical Euclidian distance and the “economic” distance. The
significance of the test presented in those two tables indicates that the spatial
autocorrelation of GDP among the nearest regencies/cities in East Java is not
significant even the neighbours are extended up to 5 nearest neighbours, both
for the physical – geographical distance and the economic distance. This initial
result motivates this study to use another concept of distance to form the
neighbours, namely the critical cut off neighbours.
23 | I S I W S C 2 0 1 9