
Page 36 - Contributed Paper Session (CPS) - Volume 2
P. 36
CPS1409 Rahma F.
4. Discussion and Conclusion
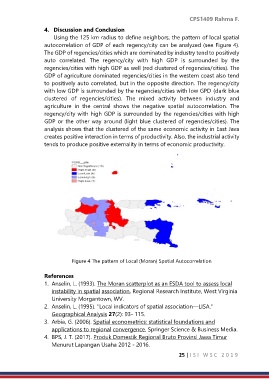
Using the 125 km radius to define neighbors, the pattern of local spatial
autocorrelation of GDP of each regency/city can be analyzed (see Figure 4).
The GDP of regencies/cities which are dominated by industry tend to positively
auto correlated. The regency/city with high GDP is surrounded by the
regencies/cities with high GDP as well (red clustered of regencies/cities). The
GDP of agriculture dominated regencies/cities in the western coast also tend
to positively auto correlated, but in the opposite direction. The regency/city
with low GDP is surrounded by the regencies/cities with low GPD (dark blue
clustered of regencies/cities). The mixed activity between industry and
agriculture in the central shows the negative spatial autocorrelation. The
regency/city with high GDP is surrounded by the regencies/cities with high
GDP or the other way around (light blue clustered of regencies/cities). The
analysis shows that the clustered of the same economic activity in East Java
creates positive interaction in terms of productivity. Also, the industrial activity
tends to produce positive externality in terms of economic productivity.
Figure 4 The pattern of Local (Moran) Spatial Autocorrelation
References
1. Anselin, L. (1993). The Moran scatterplot as an ESDA tool to assess local
instability in spatial association, Regional Research Institute, West Virginia
University Morgantown, WV.
2. Anselin, L. (1995). "Local indicators of spatial association—LISA."
Geographical Analysis 27(2): 93- 115.
3. Arbia, G. (2006). Spatial econometrics: statistical foundations and
applications to regional convergence, Springer Science & Business Media.
4. BPS, J. T. (2017). Produk Domestik Regional Bruto Provinsi Jawa Timur
Menurut Lapangan Usaha 2012 - 2016.
25 | I S I W S C 2 0 1 9