
Page 31 - Contributed Paper Session (CPS) - Volume 2
P. 31
CPS1409 Rahma F.
growth at the fourth quarter of 2017. Industry, trade, agriculture, forestry and
fishery are the dominant economic sectors in this province, which contribute
60.24% of the total 2016 GDP (BPS 2017).
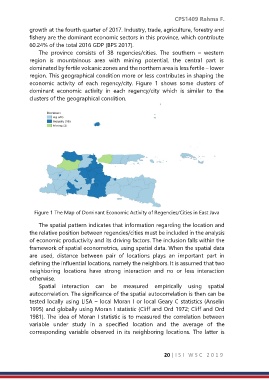
The province consists of 38 regencies/cities. The southern – western
region is mountainous area with mining potential, the central part is
dominated by fertile volcanic zones and the northern area is less fertile – lower
region. This geographical condition more or less contributes in shaping the
economic activity of each regency/city. Figure 1 shows some clusters of
dominant economic activity in each regency/city which is similar to the
clusters of the geographical condition.
Figure 1 The Map of Dominant Economic Activity of Regencies/Cities in East Java
The spatial pattern indicates that information regarding the location and
the relative position between regencies/cities must be included in the analysis
of economic productivity and its driving factors. The inclusion falls within the
framework of spatial econometrics, using spatial data. When the spatial data
are used, distance between pair of locations plays an important part in
defining the influential locations, namely the neighbors. It is assumed that two
neighboring locations have strong interaction and no or less interaction
otherwise.
Spatial interaction can be measured empirically using spatial
autocorrelation. The significance of the spatial autocorrelation is then can be
tested locally using LISA – local Moran I or local Geary C statistics (Anselin
1995) and globally using Moran I statistic (Cliff and Ord 1972; Cliff and Ord
1981). The idea of Moran I statistic is to measured the correlation between
variable under study in a specified location and the average of the
corresponding variable observed in its neighboring locations. The latter is
20 | I S I W S C 2 0 1 9