
Page 33 - Contributed Paper Session (CPS) - Volume 2
P. 33
CPS1409 Rahma F.
is used as a proxy for economic productivity. The significance of the spatial
autocorrelation of GDP among the regencies/cities is tested based on the
Moran I index, which can be interpreted as the intercept of the fitted line based
on the scatter plot between the spatial lagged GDP (Y axis) and the original
GDP (X axis) (Anselin 1993).
The spatial lagged of GDP is the product of the n × n spatial weight matrix
(W) and GDP. W is defined as follows:
11 ⁄ 11 ⁄ … 1 ⁄
1 1 1 11 12 … 1
21 ⁄ 22 ⁄ … 2 ⁄ 21 22 … 2 1, if and are neighbors
W = 2 2 1 = [ ⋮ ⋮ ⋮ ] = { 0, otherwise
1 ⋮ 2 ⋮ … ⋮ 1 2 …
[ ⁄ ⁄ ⁄ ]
This study first considers the k nearest neighbors to build the spatial
weight matrix. The concept forms the k locations with shortest distance from
as a set of neighbors of , for every = 1, ⋯ , n. Two distance measures are
used, the first one is the physical – geographical Euclidian distance, the second
one is the economic distance. This study uses the delivery cost per kg, between
two regencies/cities (based on JNE’s tariff at 2018). This approach is similar to
the work of Conley and Topa (2002). The cheaper the cost implies that in
addition to the short distance between the two locations, there is a big
possibility of intensive economic activity between those regencies/cities.
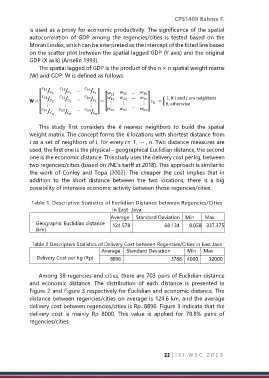
Table 1. Descriptive Statistics of Euclidian Distance between Regencies/Cities
in East Java
Average Standard Deviation Min Max
Geographic Euclidian distance 124.578 68.134 8.058 337.375
(km)
Table 2 Descriptive Statistics of Delivery Cost between Regencies/Cities in East Java
Average Standard Deviation Min Max
Delivery Cost per kg (Rp) 8896 3788 4000 32000
Among 38 regencies and cities, there are 703 pairs of Euclidian distance
and economic distance. The distribution of each distance is presented in
Figure 2 and Figure 3 respectively for Euclidian and economic distance. The
distance between regencies/cities on average is 124.6 km, and the average
delivery cost between regencies/cities is Rp. 8896. Figure 3 indicate that the
delivery cost is mainly Rp 8000. This value is applied for 78.8% pairs of
regencies/cities.
22 | I S I W S C 2 0 1 9