
Page 362 - Contributed Paper Session (CPS) - Volume 2
P. 362
CPS1887 Sahidan A. et al.
within the same region. For the last panel represents the quadratic patterns of
all nine sub regions.
Lastly, the polynomial model of second degree was fitted. It results
represent the quadratic curves of the temperature for each sub region. The
quadratic curves of the temperature within 72 sub regions were categorized
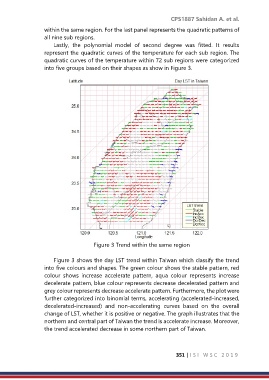
into five groups based on their shapes as show in Figure 3.
Figure 3 Trend within the same region
Figure 3 shows the day LST trend within Taiwan which classify the trend
into five colours and shapes. The green colour shows the stable pattern, red
colour shows increase accelerate pattern, aqua colour represents increase
decelerate pattern, blue colour represents decrease decelerated pattern and
grey colour represents decrease accelerate pattern. Furthermore, the plot were
further categorized into binomial terms, accelerating (accelerated-increased,
decelerated-increased) and non-accelerating curves based on the overall
change of LST, whether it is positive or negative. The graph illustrates that the
northern and central part of Taiwan the trend is accelerate increase. Moreover,
the trend accelerated decrease in some northern part of Taiwan.
351 | I S I W S C 2 0 1 9