
Page 66 - Contributed Paper Session (CPS) - Volume 2
P. 66
CPS1428 Enobong F. U.
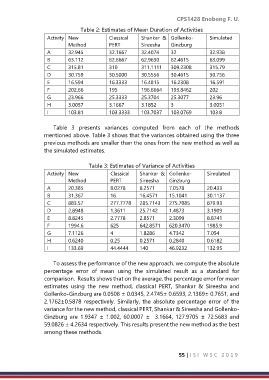
Table 2: Estimates of Mean Duration of Activities
Activity New Classical Shankar & Gollenko- Simulated
Method PERT Sireesha Ginzburg
A 32.945 32.1667 32.4074 32 32.938
B 63.112 62.6667 62.9630 62.4615 63.099
C 315.81 310 311.1111 309.2308 315.79
D 30.759 30.5000 30.5556 30.4615 30.756
E 16.594 16.3333 16.4815 16.2308 16.591
F 202.66 195 196.6664 193.8462 202
G 23.966 25.3333 25.3704 25.3077 23.96
H 3.0057 3.1667 3.1852 3 3.0051
I 103.81 103.3333 103.7037 103.0769 103.8
Table 3 presents variances computed from each of the methods
mentioned above. Table 3 shows that the variances obtained using the three
previous methods are smaller than the ones from the new method as well as
the simulated estimates.
Table 3: Estimates of Variance of Activities
Activity New Classical Shankar & Gollenko- Simulated
Method PERT Sireesha Ginzburg
A 20.385 8.0278 8.2571 7.0578 20.433
B 31.367 16 16.4571 15.1041 30.1137
C 883.57 277.7778 285.7143 275.7085 879.93
D 2.8948 1.3611 25.7142 1.4873 3.1909
E 8.8245 2.7778 2.8571 2.3099 8.8741
F 1994.6 625 642.8571 620.3470 1985.9
G 7.1126 4 1.8286 4.7342 7.054
H 0.6240 0.25 0.2571 0.2840 0.6182
I 133.69 44.4444 140 46.9232 132.95
To assess the performance of the new approach, we compute the absolute
percentage error of mean using the simulated result as a standard for
comparison. Results shows that on the average, the percentage error for mean
estimates using the new method, classical PERT, Shankar & Sireesha and
Gollenko-Ginzburg are 0.0508 ± 0.0345, 2.4745± 0.6593, 2.1369± 0.7651, and
2.1762±0.5878 respectively. Similarly, the absolute percentage error of the
variance for the new method, classical PERT, Shankar & Sireesha and Gollenko-
Ginzburg are 1.9347 ± 1.002, 60.0007 ± 3.1664, 127.9705 ± 72.5683 and
59.0826 ± 4.2634 respectively. This results present the new method as the best
among these methods.
55 | I S I W S C 2 0 1 9