Page 99 - Contributed Paper Session (CPS) - Volume 2
P. 99

CPS1442 Uzuke C.A. et al.
            3.   Illustration
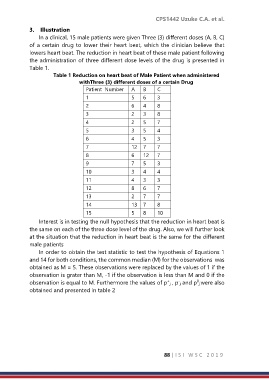
                In a clinical, 15 male patients were given Three (3) different doses (A, B, C)
            of a certain drug to lower their heart beat, which the clinician believe that
            lowers heart beat. The reduction in heart beat of these male patient following
            the administration of three different dose levels of the drug is presented in
            Table 1.
                     Table 1 Reduction on heart beat of Male Patient when administered
                               withThree (3) different doses of a certain Drug
                                  Patient  Number   A   B    C
                                  1                5    6    3
                                  2                6    4    8
                                  3                2    3    8
                                  4                2    5    7
                                  5                3    5    4
                                  6                4    5    3
                                  7                12  7     7
                                  8                6    12   7
                                  9                7    5    3
                                  10               3    4    4
                                  11               4    3    3
                                  12               8    6    7
                                  13               2    7    7
                                  14               13  7     8
                                  15               5    8    10
                Interest is in testing the null hypothesis that the reduction in heart beat is
            the same on each of the three dose level of the drug. Also, we will further look
            at the situation that the reduction in heart beat is the same for the different
            male patients
                In order to obtain the test statistic to test the hypothesis of Equations 1
            and 14 for both conditions, the common median (M) for the observations  was
            obtained as M = 5. These observations were replaced by the values of 1 if the
            observation is grater than M, -1 if the observation is less than M and 0 if the
            observation is equal to M. Furthermore the values of p j , p j and p j were also
                                                                 +
                                                                     -
                                                                             0
            obtained and presented in table 2


                                                                88 | I S I   W S C   2 0 1 9
   94   95   96   97   98   99   100   101   102   103   104