
Page 418 - Contributed Paper Session (CPS) - Volume 4
P. 418
CPS2476 Tite Habiyakare et al.
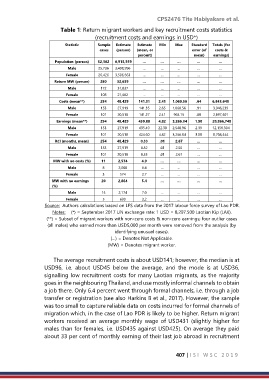
Table 1: Return migrant workers and key recruitment costs statistics
(recruitment costs and earnings in USD*)
Statistic Sample Estimate Estimate Min Max Standard Totals (for
cases (person) (mean, or error (of costs &
percent) mean) earnings)
Population (person) 52,162 6,915,559 … … … … …
Male 25,736 3,408,996 … … … … …
Female 26,426 3,506,563 … … … … …
Return MW (person) 280 52,639 … … … … …
Male 172 31,037 … … … … …
Female 108 21,602 … … … … …
Costs (mean**) 254 48,429 141.31 2.41 1,060.56 .64 6,843,640
Male 153 27,919 141.35 2.65 1,060.56 .91 3,946,239
Female 101 20,510 141.27 2.41 964.15 .88 2,897,401
Earnings (mean**) 254 48,429 430.88 4.82 3,266.04 1.90 20,866,748
Male 153 27,919 435.49 22.30 2,548.96 2.39 12,158,304
Female 101 20,510 424.60 4.82 3,266.04 3.08 8,708,444
RCI (months, mean) 254 48,429 0.33 .01 2.67 … …
Male 153 27,919 0.32 .01 2.50 … …
Female 101 20,510 0.33 .01 2.67 … …
MW with no costs (%) 11 2,574 4.9 … … … …
Male 8 2,000 6.4 … … … …
Female 3 574 2.7 … … … …
MW with no earnings 20 2,864 5.4 … … … …
(%)
Male 15 2,174 7.0 … … … …
Female 5 690 3.2 … … … …
Source: Authors calculations based on LFS data from the 2017 labour force survey of Lao PDR.
Notes: (*) = September 2017 UN exchange rate: 1 USD = 8,297.500 Laotian Kip (LAK).
(**) = Subset of migrant workers with non-zero costs & non-zero earnings; four outlier cases
(all males) who earned more than USD5,000 per month were removed from the analysis (by
identifying unusual cases).
(…) = Denotes Not Applicable.
(MW) = Denotes migrant worker.
The average recruitment costs is about USD141; however, the median is at
USD96, i.e. about USD45 below the average, and the mode is at USD36,
signalling low recruitment costs for many Laotian migrants, as the majority
goes in the neighbouring Thailand, and use mostly informal channels to obtain
a job there. Only 6.4 percent went through formal channels, i.e. through a job
transfer or registration (see also Harkins B et al., 2017). However, the sample
was too small to capture reliable data on costs incurred for formal channels of
migration which, in the case of Lao PDR is likely to be higher. Return migrant
workers received an average monthly wage of USD431 (slightly higher for
males than for females, i.e. USD435 against USD425). On average they paid
about 33 per cent of monthly earning of their last job abroad in recruitment
407 | I S I W S C 2 0 1 9