
Page 419 - Contributed Paper Session (CPS) - Volume 4
P. 419
CPS2476 Tite Habiyakare et al.
costs. The total of all recruitment costs was estimated at USD 6.8 million (i.e.
0.04 per cent of the 2017 country’s GDP).
Distribution of recruitment costs and earnings
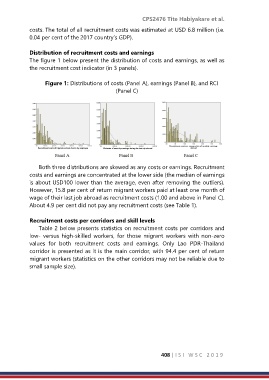
The figure 1 below present the distribution of costs and earnings, as well as
the recruitment cost indicator (in 3 panels).
Figure 1: Distributions of costs (Panel A), earnings (Panel B), and RCI
(Panel C)
Both three distributions are skewed as any costs or earnings. Recruitment
costs and earnings are concentrated at the lower side (the median of earnings
is about USD100 lower than the average, even after removing the outliers).
However, 15.8 per cent of return migrant workers paid at least one month of
wage of their last job abroad as recruitment costs (1.00 and above in Panel C).
About 4.9 per cent did not pay any recruitment costs (see Table 1).
Recruitment costs per corridors and skill levels
Table 2 below presents statistics on recruitment costs per corridors and
low- versus high-skilled workers, for those migrant workers with non-zero
values for both recruitment costs and earnings. Only Lao PDR-Thailand
corridor is presented as it is the main corridor, with 94.4 per cent of return
migrant workers (statistics on the other corridors may not be reliable due to
small sample size).
408 | I S I W S C 2 0 1 9