
Page 420 - Contributed Paper Session (CPS) - Volume 4
P. 420
CPS2476 Tite Habiyakare et al.
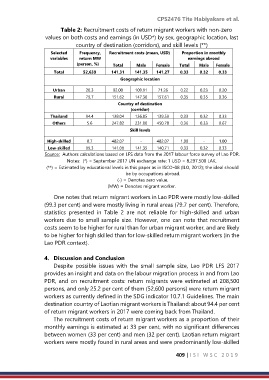
Table 2: Recruitment costs of return migrant workers with non-zero
values on both costs and earnings (in USD*) by sex, geographic location, last
country of destination (corridors), and skill levels (**)
Selected Frequency, Recruitment costs (mean, USD) Proportion in monthly
variables return MW earnings abroad
(person, %) Total Male Female Total Male Female
Total 52,639 141.31 141.35 141.27 0.33 0.32 0.33
Geographic location
Urban 20.3 92.00 109.91 71.26 0.22 0.23 0.20
Rural 79.7 151.62 147.38 157.61 0.35 0.35 0.36
Country of destination
(corridor)
Thailand 94.4 138.04 136.85 139.59 0.33 0.32 0.33
Others 5.6 247.82 231.00 450.78 0.36 0.33 0.67
Skill levels
High-skilled 0.7 482.07 - 482.07 1.00 - 1.00
Low-skilled 99.3 141.08 141.35 140.71 0.33 0.32 0.33
Source: Authors calculations based on LFS data from the 2017 labour force survey of Lao PDR.
Notes: (*) = September 2017 UN exchange rate: 1 USD = 8,297.500 LAK.
(**) = Estimated by educational levels in this paper as in ISCO-08 (ILO, 2012); the ideal should
be by occupations abroad.
(-) = Denotes zero value.
(MW) = Denotes migrant worker.
One notes that return migrant workers in Lao PDR were mostly low-skilled
(99.3 per cent) and were mostly living in rural areas (79.7 per cent). Therefore,
statistics presented in Table 2 are not reliable for high-skilled and urban
workers due to small sample size. However, one can note that recruitment
costs seem to be higher for rural than for urban migrant worker, and are likely
to be higher for high skilled than for low-skilled return migrant workers (in the
Lao PDR context).
4. Discussion and Conclusion
Despite possible issues with the small sample size, Lao PDR LFS 2017
provides an insight and data on the labour migration process in and from Lao
PDR, and on recruitment costs: return migrants were estimated at 208,500
persons, and only 25.2 per cent of them (52,600 persons) were return migrant
workers as currently defined in the SDG indicator 10.7.1 Guidelines. The main
destination country of Laotian migrant workers is Thailand: about 94.4 per cent
of return migrant workers in 2017 were coming back from Thailand.
The recruitment costs of return migrant workers as a proportion of their
monthly earnings is estimated at 33 per cent, with no significant differences
between women (33 per cent) and men (32 per cent). Laotian return migrant
workers were mostly found in rural areas and were predominantly low-skilled
409 | I S I W S C 2 0 1 9