
Page 280 - Contributed Paper Session (CPS) - Volume 6
P. 280
CPS1929 Takayuki M.
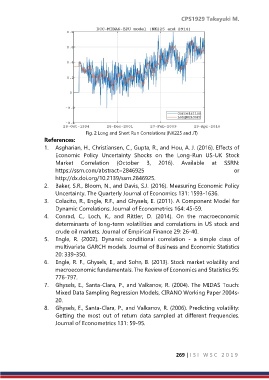
Fig. 2 Long and Short Run Correlations (NK225 and JT)
References:
1. Asgharian, H., Christiansen, C., Gupta, R., and Hou, A. J. (2016). Effects of
Economic Policy Uncertainty Shocks on the Long-Run US-UK Stock
Market Correlation (October 3, 2016). Available at SSRN:
https://ssrn.com/abstract=2846925 or
http://dx.doi.org/10.2139/ssrn.2846925.
2. Baker, S.R., Bloom, N., and Davis, S.J. (2016). Measuring Economic Policy
Uncertainty. The Quarterly Journal of Economics 131: 1593-1636.
3. Colacito, R., Engle, R.F., and Ghysels, E. (2011). A Component Model for
Dynamic Correlations. Journal of Econometrics 164: 45-59.
4. Conrad, C., Loch, K., and Rittler, D. (2014). On the macroeconomic
determinants of long-term volatilities and correlations in US stock and
crude oil markets. Journal of Empirical Finance 29: 26-40.
5. Engle, R. (2002). Dynamic conditional correlation - a simple class of
multivariate GARCH models. Journal of Business and Economic Statistics
20: 339-350.
6. Engle, R. F., Ghysels, E., and Sohn, B. (2013). Stock market volatility and
macroeconomic fundamentals. The Review of Economics and Statistics 95:
776-797.
7. Ghysels, E., Santa-Clara, P., and Valkanov, R. (2004). The MIDAS Touch:
Mixed Data Sampling Regression Models, CIRANO Working Paper 2004s-
20.
8. Ghysels, E., Santa-Clara, P., and Valkanov, R. (2006). Predicting volatility:
Getting the most out of return data sampled at different frequencies.
Journal of Econometrics 131: 59-95.
269 | I S I W S C 2 0 1 9