
Page 285 - Contributed Paper Session (CPS) - Volume 6
P. 285
CPS1930 M. Kayanan et al.
score 4 or 5 (pgg45). The response is the log of prostate specific antigen
(lpsa). The dataset has 97 observations. Stamey et al. 1989 have examined the
correlation between the level of prostate specific antigen and those eight
clinical measures. Further, Tibshirani (1996), Efron et al. (2004) and Zou &
Hastie (2003) have used this data to examine the performance of LASSO, LARS
algorithm and Enet estimators. This data set is attached with “lasso2” R
package, and we have used 50 observations to fit the model, and 47
observations to calculate the RMSE.
The UScrime dataset has 16 variables with 47 observations, and it is
attached with “MASS” R package. This data contains the following columns:
(percentage of males aged 14--24), (indicator variable for a Southern state),
(mean years of schooling), (police expenditure in 1960), (police
expenditure in 1959), (labor force participation rate), . (number of
males per 1000 females), (state population), (number of non-whites
per 1000 people), (unemployment rate of urban males 14--24),
(unemployment rate of urban males 35--39), (gross domestic product
per head), (income inequality), (probability of imprisonment),
(average time served in state prisons), (rate of crimes in a particular
category per head of population). The variable is considered as a dependent
variable, the variable is ignored since it is categorical. Venables & Ripley
(1999) have examined the effect of punishment regimes on crime rates using
this dataset. For the analysis, we have used 40 observations to fit the model,
and 7 observations to calculate the RMSE.
The RMSE for different values of the shrinkage parameter (k/d) was
calculated, and the shrinkage parameter (/) was chosen between (0, 1) for
simplicity. Further, we used K-fold cross-validation to find the optimal values
of , and .
3. Result and Discussion
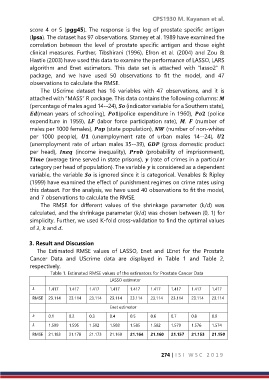
The Estimated RMSE values of LASSO, Enet and LEnet for the Prostate
Cancer Data and UScrime data are displayed in Table 1 and Table 2,
respectively.
Table 1. Estimated RMSE values of the estimators for Prostate Cancer Data
LASSO estimator
1.417 1.417 1.417 1.417 1.417 1.417 1.417 1.417 1.417
RMSE 23.114 23.114 23.114 23.114 23.114 23.114 23.114 23.114 23.114
Enet estimator
0.1 0.2 0.3 0.4 0.5 0.6 0.7 0.8 0.9
1.599 1.595 1.592 1.588 1.585 1.582 1.579 1.576 1.574
RMSE 21.183 21.178 21.173 21.169 21.164 21.160 21.157 21.153 21.150
274 | I S I W S C 2 0 1 9