
Page 286 - Contributed Paper Session (CPS) - Volume 6
P. 286
CPS1930 M. Kayanan et al.
LEnet estimator
0.1 0.2 0.3 0.4 0.5 0.6 0.7 0.8 0.9
1.574 1.577 1.580 1.583 1.586 1.589 1.592 1.596 1.599
RMSE 21.150 21.153 21.157 21.161 21.165 21.169 21.174 21.178 21.183
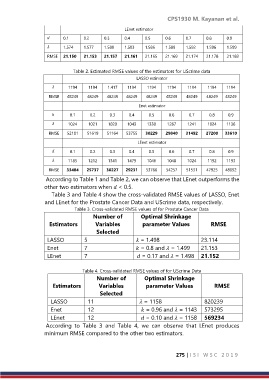
Table 2. Estimated RMSE values of the estimators for UScrime data
LASSO estimator
1194 1194 1.417 1194 1194 1194 1194 1194 1194
RMSE 48249 48249 48249 48249 48249 48249 48249 48249 48249
Enet estimator
0.1 0.2 0.3 0.4 0.5 0.6 0.7 0.8 0.9
1024 1021 1020 1043 1330 1267 1241 1024 1136
RMSE 52101 51619 51164 53755 30229 29840 31492 27200 33610
LEnet estimator
0.1 0.2 0.3 0.4 0.5 0.6 0.7 0.8 0.9
1185 1212 1341 1479 1046 1048 1024 1192 1193
RMSE 33484 25737 30227 29231 53766 54257 51531 47925 48092
According to Table 1 and Table 2, we can observe that LEnet outperforms the
other two estimators when < 0.5.
Table 3 and Table 4 show the cross-validated RMSE values of LASSO, Enet
and LEnet for the Prostate Cancer Data and UScrime data, respectively.
Table 3. Cross-validated RMSE values of for Prostate Cancer Data
Number of Optimal Shrinkage
Estimators Variables parameter Values RMSE
Selected
LASSO 5 = 1.498 23.114
Enet 7 = 0.8 and = 1.499 21.153
LEnet 7 = 0.17 and = 1.498 21.152
Table 4. Cross-validated RMSE values of for UScrime Data
Number of Optimal Shrinkage
Estimators Variables parameter Values RMSE
Selected
LASSO 11 = 1158 820239
Enet 12 = 0.96 and = 1143 573295
LEnet 12 = 0.10 and = 1158 569234
According to Table 3 and Table 4, we can observe that LEnet produces
minimum RMSE compared to the other two estimators.
275 | I S I W S C 2 0 1 9