
Page 289 - Contributed Paper Session (CPS) - Volume 6
P. 289
CPS1932 Carlos A. M. D.
- and The Unit for Comprehensive Care and Reparation for the Victims of the
Colombian Armed Conflict. Selected variables was analyzed using Global and
Local Spatial Correlation Moran’s Indexes and Spatial Regression likelihood
function from SAR, SEM and SDM models.
Data was separated in two groups: Before dialogs (2007 - 2011) and after
3
dialogs (2012 - 2016) . Because of data structure, it was not possible analyzed
under spatial panel data methodologies.
3. Results
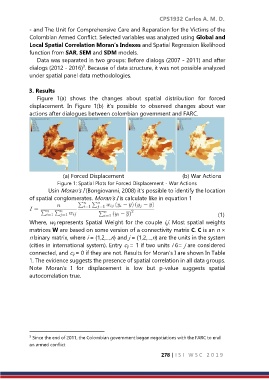
Figure 1(a) shows the changes about spatial distribution for forced
displacement. In Figure 1(b) it’s possible to observed changes about war
actions after dialogues between colombian government and FARC.
(a) Forced Displacement (b) War Actions
Figure 1: Spatial Plots for Forced Displacement - War Actions
Usin Moran’s I (Bongiovanni, 2008) it’s possible to identify the location
of spatial conglomerates. Moran’s I is calculate like in equation 1
(1)
Where, wij represents Spatial Weight for the couple i,j. Most spatial weights
matrices W are based on some version of a connectivity matrix C. C is an n ×
n binary matrix, where i = {1,2,...,n} and j = {1,2,...,n} are the units in the system
(cities in international system). Entry cij = 1 if two units i 6= j are considered
connected, and cij = 0 if they are not. Results for Moran’s I are shown In Table
1. The evidence suggests the presence of spatial correlation in all data groups.
Note Moran’s I for displacement is low but p-value suggests spatial
autocorrelation true.
3 Since the end of 2011, the Colombian government began negotiations with the FARC to end
an armed conflict
278 | I S I W S C 2 0 1 9