
Page 290 - Contributed Paper Session (CPS) - Volume 6
P. 290
CPS1932 Carlos A. M. D.
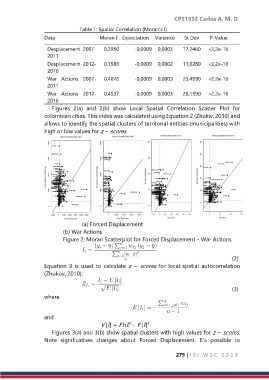
Table 1: Spatial Correlation (Moran’s I)
Data Moran I Expectation Variance St Dev P-Value
Desplacement 2007- 0,2950 -0,0009 0,0003 17,2460 <2,2e-16
2011
Desplacement 2012- 0,1586 -0,0009 0,0002 11,0280 <2,2e-16
2016
War Actions 2007- 0,4076 -0,0009 0,0003 23,4990 <2,2e-16
2011
War Actions 2012- 0,4537 -0,0009 0,0003 26,1590 <2,2e-16
2016
Figures 2(a) and 2(b) show Local Spatial Correlation Scatter Plot for
colombian cities. This index was calculated using Equation 2 (Zhukiv, 2010) and
allows to identify the spatial clusters of territorial entities (municipalities) with
high or low values for z − scores.
(a) Forced Displacement
(b) War Actions
Figure 2: Moran Scatterplot for Forced Displacement - War Actions
(2)
Equation 3 is used to calculate z − scores for local spatial autocorrelation
(Zhukov, 2010):
(3)
where
and
2
2i
V [Ii] = E hIi − E [Ii]
Figures 3(a) and 3(b) show spatial clusters with high values for z − scores.
Note significatives changes about Forced Displacement. It’s possible to
279 | I S I W S C 2 0 1 9