
Page 291 - Contributed Paper Session (CPS) - Volume 6
P. 291
CPS1932 Carlos A. M. D.
observe 6 clusters in period 2007 2011 and only 3 clusters in period 2012 -
2016. On the other hand, war actions show changes in the clusters observed,
going from 10 during the period 2007 - 2011 to 5 in the period 2012 - 2016.
With this results it’s possible to propose some spatial regression models: SAR,
SEM and SDM.
4. Discussion and Conclusions
This paper consider the following models for Spatial Analysis about
colombian forced migrations: Spatial Autoregressive Model (SAR), Spatial Error
Model (SEM) and Spatial Durbin Model (SDM). Table 2 shows differents
parameters for the models estimates. Previously, data was separated in two
group: before and after of dialogues to understand changes in spatial
relationships between variables in study.
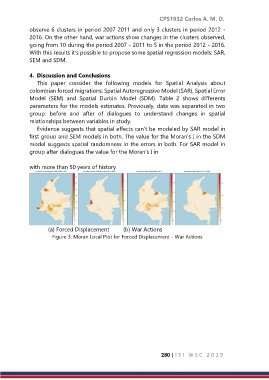
Evidence suggests that spatial effects can’t be modeled by SAR model in
first group and SEM models in both. The value for the Moran’s I in the SDM
model suggests spatial randomness in the errors in both. For SAR model in
group after dialogues the value for the Moran’s I in
with more than 50 years of history.
(a) Forced Displacement (b) War Actions
Figure 3: Moran Local Plot for Forced Displacement - War Actions
280 | I S I W S C 2 0 1 9