
Page 398 - Invited Paper Session (IPS) - Volume 1
P. 398
IPS173 Athanasios Petralias et al.
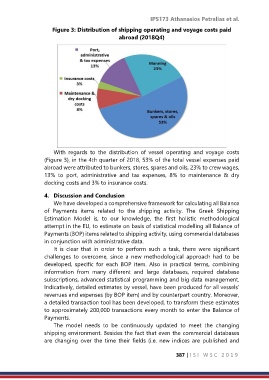
Figure 3: Distribution of shipping operating and voyage costs paid
abroad (2018Q4)
With regards to the distribution of vessel operating and voyage costs
(Figure 3), in the 4th quarter of 2018, 53% of the total vessel expenses paid
abroad were attributed to bunkers, stores, spares and oils, 23% to crew wages,
13% to port, administrative and tax expenses, 8% to maintenance & dry
docking costs and 3% to insurance costs.
4. Discussion and Conclusion
We have developed a comprehensive framework for calculating all Balance
of Payments items related to the shipping activity. The Greek Shipping
Estimation Model is, to our knowledge, the first holistic methodological
attempt in the EU, to estimate on basis of statistical modelling all Balance of
Payments (BOP) items related to shipping activity, using commercial databases
in conjunction with administrative data.
It is clear that in order to perform such a task, there were significant
challenges to overcome, since a new methodological approach had to be
developed, specific for each BOP item. Also in practical terms, combining
information from many different and large databases, required database
subscriptions, advanced statistical programming and big data management.
Indicatively, detailed estimates by vessel, have been produced for all vessels’
revenues and expenses (by BOP item) and by counterpart country. Moreover,
a detailed transaction tool has been developed, to transform these estimates
to approximately 200,000 transactions every month to enter the Balance of
Payments.
The model needs to be continuously updated to meet the changing
shipping environment. Besides the fact that even the commercial databases
are changing over the time their fields (i.e. new indices are published and
387 | I S I W S C 2 0 1 9