
Page 299 - Special Topic Session (STS) - Volume 3
P. 299
STS544 Paolo F. et al.
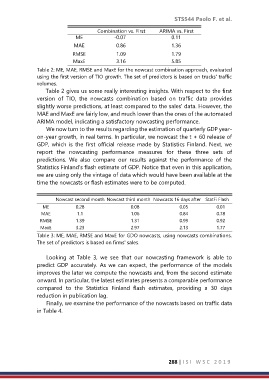
Combination vs. First ARIMA vs. First
ME -0.07 0.11
MAE 0.86 1.36
RMSE 1.09 1.79
MaxE 3.16 5.85
Table 2: ME, MAE, RMSE and MaxE for the nowcast combination approach, evaluated
using the first version of TIO growth. The set of predictors is based on trucks' traffic
volumes.
Table 2 gives us some really interesting insights. With respect to the first
version of TIO, the nowcasts combination based on traffic data provides
slightly worse predictions, at least compared to the sales' data. However, the
MAE and MaxE are fairly low, and much lower than the ones of the automated
ARIMA model, indicating a satisfactory nowcasting performance.
We now turn to the results regarding the estimation of quarterly GDP year-
on-year growth, in real terms. In particular, we nowcast the t + 60 release of
GDP, which is the first official release made by Statistics Finland. Next, we
report the nowcasting performance measures for these three sets of
predictions. We also compare our results against the performance of the
Statistics Finland's flash estimate of GDP. Notice that even in this application,
we are using only the vintage of data which would have been available at the
time the nowcasts or flash estimates were to be computed.
Nowcast second month Nowcast third month Nowcasts 16 days after StatFi Flash
ME 0.28 0.08 0.05 0.01
MAE 1.1 1.06 0.84 0.78
RMSE 1.39 1.31 0.99 0.92
MaxE 3.23 2.97 2.13 1.77
Table 3: ME, MAE, RMSE and MaxE for GDO nowcasts, using nowcasts combinations.
The set of predictors is based on firms' sales.
Looking at Table 3, we see that our nowcasting framework is able to
predict GDP accurately. As we can expect, the performance of the models
improves the later we compute the nowcasts and, from the second estimate
onward. In particular, the latest estimates presents a comparable performance
compared to the Statistics Finland flash estimates, providing a 30 days
reduction in publication lag.
Finally, we examine the performance of the nowcasts based on traffic data
in Table 4.
288 | I S I W S C 2 0 1 9