
Page 420 - Special Topic Session (STS) - Volume 3
P. 420
STS552 Natalia Nehrebecka
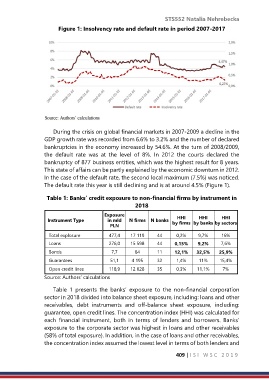
Figure 1: Insolvency rate and default rate in period 2007-2017
During the crisis on global financial markets in 2007-2009 a decline in the
GDP growth rate was recorded from 6.6% to 3.2% and the number of declared
bankruptcies in the economy increased by 54.6%. At the turn of 2008/2009,
the default rate was at the level of 8%. In 2012 the courts declared the
bankruptcy of 877 business entities, which was the highest result for 8 years.
This state of affairs can be partly explained by the economic downturn in 2012.
In the case of the default rate, the second local maximum (7.5%) was noticed.
The default rate this year is still declining and is at around 4.5% (Figure 1).
Table 1: Banks' credit exposure to non-financial firms by instrument in
2018
Exposure
Instrument Type in mld N firms N banks HHI HHI HHI
PLN by firms by banks by sectors
Total explosure 477,4 17 119 44 0,2% 9,7% 16%
Loans 276,0 15 598 44 0,15% 9,2% 7,6%
Bonds 7,7 84 11 12,1% 32,5% 25,9%
Guarantees 51,1 4 195 32 1,4% 11% 15,4%
Open credit lines 118,9 12 028 35 0,3% 11,1% 7%
Source: Authors’ calculations
Table 1 presents the banks’ exposure to the non-financial corporation
sector in 2018 divided into balance sheet exposure, including: loans and other
receivables, debt instruments and off-balance sheet exposure, including:
guarantee, open credit lines. The concentration index (HHI) was calculated for
each financial instrument, both in terms of lenders and borrowers. Banks’
exposure to the corporate sector was highest in loans and other receivables
(58% of total exposure). In addition, in the case of loans and other receivables,
the concentration index assumed the lowest level in terms of both lenders and
409 | I S I W S C 2 0 1 9