
Page 429 - Special Topic Session (STS) - Volume 3
P. 429
STS552 João Falcão Silva et al.
There are some issues associated with the use of LBS as a data source. First,
9
data on banks’ liabilities to the households are collected on an encouraged
basis only from end-December 2013, which does not ensure full data
10
coverage . Secondly, only 13 countries started reporting these data from the
end-December 2013 and another 17 countries started reporting in subsequent
quarters . Thirdly, due to confidentiality reasons data for some countries is
11
not published and thus we cannot disclose all the estimates on bilateral data.
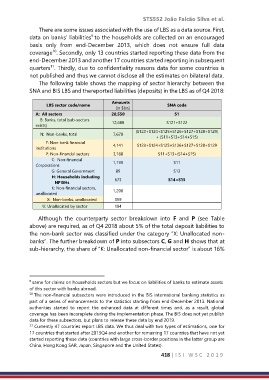
The following table shows the mapping of sector hierarchy between the
SNA and BIS LBS and thereported liabilities (deposits) in the LBS as of Q4 2018:
Amounts
LBS sector code/name SNA code
[in $bn]
A: All sectors 20,550 S1
B: Banks, total (sub-sectors 12,688 S121+S122
exists)
(S123+S124+S125+S126+S127+S128+S129)
N: Non-banks, total 7,678
+ (S11+S13+S14+S15)
F: Non-bank financial
institutions 4,141 S123+S124+S125+S126+S127+S128+S129
P: Non-financial sectors 3,168 S11+S13+(S14+S15)
C: Non-financial
Corporations 1,199 S11
G: General Government 89 S13
H: Households including
NPISHs 673 S14+S15
K: Non-financial sectors, 1,208
unallocated
X: Non-banks, unallocated 369
U: Unallocated by sector 184
Although the counterparty sector breakdown into F and P (see Table
above) are required, as of Q4 2018 about 5% of the total deposit liabilities to
the non-bank sector was classified under the category “X: Unallocated non-
banks”. The further breakdown of P into subsectors C, G and H shows that at
sub-hierarchy, the share of “K: Unallocated non-financial sector” is about 16%
9 same for claims on households sectors but we focus on liabilities of banks to estimate assets
of this sector with banks abroad.
10 The non-financial subsectors were introduced in the BIS international banking statistics as
part of a series of enhancements to the statistics starting from end-December 2013. National
authorities started to report the enhanced data at different times and, as a result, global
coverage has been incomplete during the implementation phase. The BIS does not yet publish
data for these subsectors, but plans to release these data by end 2019.
Currently 47 countries report LBS data. We thus deal with two types of estimations, one for
11
17 countries that started after 2013Q4 and another for remaining 17 countries that have not yet
started reporting these data (countries with large cross-border positions in the latter group are
China, Hong Kong SAR, Japan, Singapore and the United States).
418 | I S I W S C 2 0 1 9