
Page 144 - Contributed Paper Session (CPS) - Volume 2
P. 144
CPS1474 Jing R. et al.
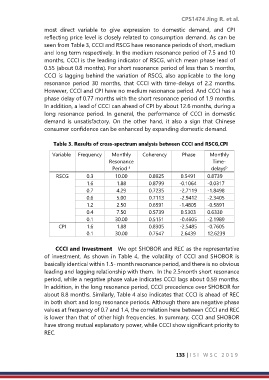
most direct variable to give expression to domestic demand, and CPI
reflecting price level is closely related to consumption demand. As can be
seen from Table 3, CCCI and RSCG have resonance periods of short, medium
and long term respectively. In the medium resonance period of 7.5 and 10
months, CCCI is the leading indicator of RSCG, which mean phase lead of
0.55 (about 0.8 months). For short resonance period of less than 5 months,
CCCI is lagging behind the variation of RSCG, also applicable to the long
resonance period 30 months, that CCCI with time-delays of 2.2 months.
However, CCCI and CPI have no medium resonance period. And CCCI has a
phase delay of 0.77 months with the short resonance period of 1.9 months.
In addition, a lead of CCCI can ahead of CPI by about 12.6 months, during a
long resonance period. In general, the performance of CCCI in domestic
demand is unsatisfactory. On the other hand, it also a sign that Chinese
consumer confidence can be enhanced by expanding domestic demand.
Table 3. Results of cross-spectrum analysis between CCCI and RSCG,CPI
Variable Frequency Monthly Coherency Phase Monthly
Resonance Time-
b
Period delays
a
RSCG 0.3 10.00 0.8925 0.5491 0.8739
1.6 1.88 0.8799 -0.1064 -0.0317
0.7 4.29 0.7235 -2.7119 -1.8498
0.6 5.00 0.7113 -2.9412 -2.3405
1.2 2.50 0.6591 -1.4805 -0.5891
0.4 7.50 0.5739 0.5303 0.6330
0.1 30.00 0.5151 -0.4605 -2.1989
CPI 1.6 1.88 0.8305 -2.5485 -0.7605
0.1 30.00 0.7547 2.6439 12.6239
CCCI and Investment We opt SHOBOR and REC as the representative
of investment. As shown in Table 4, the volatility of CCCI and SHOBOR is
basically identical within 1.5- month resonance period, and there is no obvious
leading and lagging relationship with them. In the 2.5month short resonance
period, while a negative phase value indicates CCCI lags about 0.59 months.
In addition, in the long resonance period, CCCI precedence over SHOBOR for
about 8.8 months. Similarly, Table 4 also indicates that CCCI is ahead of REC
in both short and long resonance periods. Although there are negative phase
values at frequency of 0.7 and 1.4, the correlation here between CCCI and REC
is lower than that of other high frequencies. In summary, CCCI and SHOBOR
have strong mutual explanatory power, while CCCI show significant priority to
REC.
133 | I S I W S C 2 0 1 9