
Page 141 - Contributed Paper Session (CPS) - Volume 2
P. 141
CPS1474 Jing R. et al.
|ℎ ()| 2
2
, () = ,
ℎ , () × ℎ , ()
The cross-spectrum technique is more intuitive and realistic in describing
the correlation of CCCI and macro-economy indicators, and does not lose
historical data information.
3. Result
In our study, the data set includes the CCCI and its sub-indices, which
span the period between 2009Q1 and 2018Q3. We use Real Estate Climate
Index (REC) and Shang Hai Interbank Offered Rate (SHIOR) to represent
investment status. And Total Retail Sales of Consumer Goods (RSCG) and CCI
for domestic demand. Net Exports (NE) are utilized to on behalf of export
condition. We also use the GDP as indicators of general economic
development. Except CCCI, other variables used their year-on-year
fluctuation ratio. All these data are adjusted to quarterly coinciding with
quarterly announcements CCCI by geometric mean. CCCI and its sub-indices
are from the survey of CCCI Research Institute (CUEB and CUFE), while all the
remaining variables from China National Bureau of Statistics. Since we use
the year-on-year data, seasonally adjusted are not made in this paper.
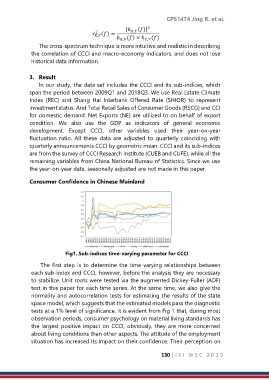
Consumer Confidence in Chinese Mainland
Fig1. Sub-indices time-varying parameter for CCCI
The first step is to determine the time-varying relationships between
each sub-index and CCCI, however, before the analysis they are necessary
to stabilize. Unit roots were tested via the augmented Dickey-Fuller (ADF)
test in this paper for each time series. At the same time, we also give the
normality and autocorrelation tests for estimating the results of the state
space model, which suggests that the estimated models pass the diagnostic
tests at a 1% level of significance. It is evident from Fig 1 that, during most
observation periods, consumer psychology on material living standards has
the largest positive impact on CCCI, obviously, they are more concerned
about living conditions than other aspects. The attitude of the employment
situation has increased its impact on their confidence. Their perception on
130 | I S I W S C 2 0 1 9