
Page 26 - Contributed Paper Session (CPS) - Volume 2
P. 26
CPS1408 Caston S. et al.
3.3 Evaluation of prediction intervals
Empirical prediction intervals (PIs) are constructed using the forecasts from
the models M4 to M6. The constructed PIs are then used to find PIWs, PINAWs,
PINADs and calculation of the number of forecasts below and above the PIs
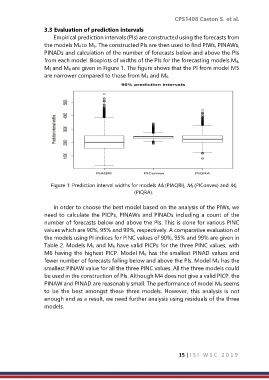
from each model. Boxplots of widths of the PIs for the forecasting models M4,
M5 and M6 are given in Figure 1. The figure shows that the PI from model M5
are narrower compared to those from M4 and M6.
Figure 1: Prediction interval widths for models M4 (PIAQRI), M5 (PIConvex) and M6
(PIQRA).
In order to choose the best model based on the analysis of the PIWs, we
need to calculate the PICPs, PINAWs and PINADs including a count of the
number of forecasts below and above the PIs. This is done for various PINC
values which are 90%, 95% and 99%, respectively. A comparative evaluation of
the models using PI indices for PINC values of 90%, 95% and 99% are given in
Table 2. Models M5 and M6 have valid PICPs for the three PINC values, with
M6 having the highest PICP. Model M6 has the smallest PINAD values and
fewer number of forecasts falling below and above the PIs. Model M4 has the
smallest PINAW value for all the three PINC values. All the three models could
be used in the construction of PIs. Although M4 does not give a valid PICP, the
PINAW and PINAD are reasonably small. The performance of model M6 seems
to be the best amongst these three models. However, this analysis is not
enough and as a result, we need further analysis using residuals of the three
models.
15 | I S I W S C 2 0 1 9