
Page 27 - Contributed Paper Session (CPS) - Volume 2
P. 27
CPS1408 Caston S. et al.
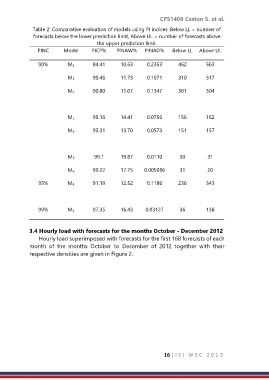
Table 2: Comparative evaluation of models using PI indices. Below LL = number of
forecasts below the lower prediction limit, Above UL = number of forecasts above
the upper prediction limit.
PINC Model PICP% PINAW% PINAD% Below LL Above UL
90% M4 84.41 10.63 0.2353 462 563
M5 90.46 11.73 0.1671 310 317
M6 90.80 11.07 0.1347 301 304
M5 95.16 14.41 0.0756 156 162
M6 95.31 13.70 0.0573 151 157
M5 99.1 19.87 0.0110 30 31
M6 99.22 17.75 0.005986 31 20
95% M4 91.19 12.52 0.1186 236 343
99% M4 97.35 16.43 0.03127 36 138
3.4 Hourly load with forecasts for the months October - December 2012
Hourly load superimposed with forecasts for the first 168 forecasts of each
month of the months October to December of 2012 together with their
respective densities are given in Figure 2.
16 | I S I W S C 2 0 1 9