
Page 341 - Contributed Paper Session (CPS) - Volume 2
P. 341
CPS1878 Zakir H. et al.
3.1.1 Results of misspecification of the random effects distributions
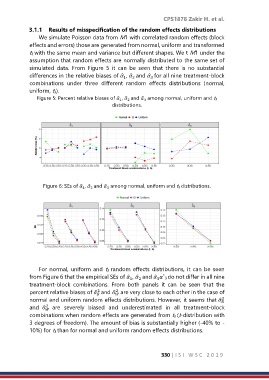
We simulate Poisson data from M1 with correlated random effects (block
effects and errors) those are generated from normal, uniform and transformed
t3 with the same mean and variance but different shapes. We t M1 under the
assumption that random effects are normally distributed to the same set of
simulated data. From Figure 5 it can be seen that there is no substantial
differences in the relative biases of ̂ , ̂ and ̂ for all nine treatment-block
3
1
2
combinations under three different random effects distributions (normal,
uniform, t3).
Figure 5: Percent relative biases of ̂ , ̂ and ̂ among normal, uniform and t3
1
2
3
distributions.
Figure 6: SEs of ̂ , ̂ and ̂ among normal, uniform and t3 distributions.
2
3
1
For normal, uniform and t3 random effects distributions, it can be seen
from Figure 6 that the empirical SEs of ̂ , ̂ and ̂ αˆ3 do not differ in all nine
3
1
2
treatment-block combinations. From both panels it can be seen that the
2
2
percent relative biases of ̂ and ̂ are very close to each other in the case of
normal and uniform random effects distributions. However, it seems that ̂ 2
2
and ̂ are severely biased and underestimated in all treatment-block
combinations when random effects are generated from t3 (t-distribution with
3 degrees of freedom). The amount of bias is substantially higher (-40% to -
10%) for t3 than for normal and uniform random effects distributions.
330 | I S I W S C 2 0 1 9