Page 387 - Contributed Paper Session (CPS) - Volume 2
P. 387

CPS1891 Tzee-Ming Huang
               For comparison purpose, two other knot selection methods: Method 2 and
            Method 3, are applied to the same 100 data sets, and the results are also
            reported in Table 1, where the details of Method 2 and Method 3 are given
            below. Method 2 is a modified version of the knot selection scheme in Zhou
            and Shen (2001). There are four steps in the scheme in Zhou and Shen (2001).
            To save computation time, the number of iterations between Step 2 and Step
            3 is limited to three, and in Step 4, the algorithm does not go back to Step 2
            for refinement. The initial knot set is {0:5} and the spline order is 3.
               For Method 3, five sets of equally spaced knots:  , … ,   are considered,
                                                                       5
                                                                 1
            where
                                       = {ℓ/2 : ℓ = 1, … , 2 }


            for   =  1, … , 5, and then BIC is used to choose one of the  five sets as the
            selected knot set. All knots in the selected knot set are used.
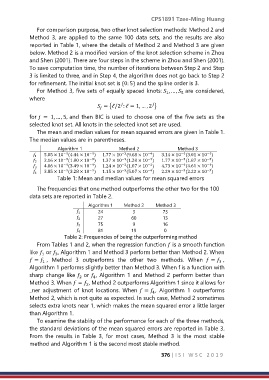
               The mean and median values for mean squared errors are given in Table 1.
            The median values are in parentheses.

                       Algorithm 1             Method 2              Method 3
               1    5.05 × 10 (4.44 × 10 )   1.77 × 10 (9.68 × 10 )   3.14 × 10 (3.01 × 10 )
                                                                                −4
                                                −3
                                                          −4
                                                                      −4
                         −4
                                   −4
               2    2.16 × 10 (1.80 × 10 )   1.37 × 10 (1.28 × 10 )   1.77 × 10 (1.87 × 10 )
                                                                                −3
                                                −3
                         −3
                                                                      −3
                                                          −3
                                   −3
               3    4.06 × 10 (3.49 × 10 )   1.24 × 10 (1.07 × 10 )   4.73 × 10 (4.61 × 10 )
                                                −3
                         −4
                                                          −3
                                   −4
                                                                                −4
                                                                      −4
               4    3.85 × 10 (3.28 × 10 )   1.15 × 10 (5.07 × 10 )   2.29 × 10 (2.22 × 10 )
                                   −4
                                                                      −3
                                                                                −3
                                                −3
                                                          −4
                         −4
                       Table 1: Mean and median values for mean squared errors

               The frequencies that one method outperforms the other two for the 100
            data sets are reported in Table 2.

                                   Algorithm 1   Method 2    Method 3
                               1     24           3          73
                               2     27          60          13
                               3     75           9          16
                               4     81          19           0
                          Table 2: Frequencies of being the outperforming method
               From Tables 1 and 2, when the regression function  is a smooth function
            like   or  , Algorithm 1 and Method 3 perform better than Method 2. When
                 1
                      3
             =  ,  Method  3  outperforms  the  other  two  methods.  When   =  ,
                 1
                                                                                     3
            Algorithm 1 performs slightly better than Method 3. When f is a function with
            sharp change like   or  , Algorithm 1 and Method 2 perform better than
                                     4
                               2
            Method 3. When  =  , Method 2 outperforms Algorithm 1 since it allows for
                                  2
            _ner  adjustment  of  knot  locations.  When  =  ,  Algorithm  1  outperforms
                                                           4
            Method 2, which is not quite as expected. In such case, Method 2 sometimes
            selects extra knots near 1, which makes the mean squared error a little larger
            than Algorithm 1.
               To examine the stablity of the performance for each of the three methods,
            the standard deviations of the mean squared errors are reported in Table 3.
            From  the  results  in  Table  3,  for  most  cases,  Method  3  is  the  most  stable
            method and Algorithm 1 is the second most stable method.
                                                               376 | I S I   W S C   2 0 1 9
   382   383   384   385   386   387   388   389   390   391   392