
Page 311 - Contributed Paper Session (CPS) - Volume 6
P. 311
CPS1937 Xu Sun et al.
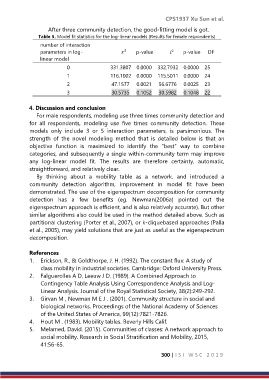
After three community detection, the good-fitting model is got.
Table 5. Model fit statistics for the log-linear models (Results for female respondents)
number of interaction
2
parameters in log- p-value L p-value DF
2
linear model
0 331.3807 0.0000 332.7932 0.0000 25
1 116.1002 0.0000 115.5011 0.0000 24
2 47.1577 0.0021 56.6776 0.0025 23
3 30.5735 0.1052 30.5982 0.1048 22
4. Discussion and conclusion
For male respondents, modeling use three times community detection and
for all respondents, modeling use five times community detection. These
models only include 3 or 5 interaction parameters, is parsimonious. The
strength of the novel modeling method that is detailed below is that an
objective function is maximized to identify the “best” way to combine
categories, and subsequently a single within-community term may improve
any log-linear model fit. The results are therefore certainty, automatic,
straightforward, and relatively clear.
By thinking about a mobility table as a network, and introduced a
community detection algorithm, improvement in model fit have been
demonstrated. The use of the eigenspectrum decomposition for community
detection has a few benefits (eg. Newman(2006a) pointed out the
eigenspectrum approach is efficient, and is also relatively accurate). But other
similar algorithms also could be used in the method detailed above. Such as
partitional clustering (Porter et al., 2007), or k-cliquebased approaches (Palla
et al., 2005), may yield solutions that are just as useful as the eigenspectrum
decomposition.
References
1. Erickson, R., & Goldthorpe, J. H. (1992). The constant flux: A study of
class mobility in industrial societies. Cambridge: Oxford University Press.
2. Falguerolles A D, Leeuw J D. (1989). A Combined Approach to
Contingency Table Analysis Using Correspondence Analysis and Log-
Linear Analysis. Journal of the Royal Statistical Society, 38(2):249-292.
3. Girvan M , Newman M E J . (2001). Community structure in social and
biological networks. Proceedings of the National Academy of Sciences
of the United States of America, 99(12):7821-7826.
4. Hout M . (1983). Mobility tables. Beverly Hills Calif.
5. Melamed, David. (2015). Communities of classes: A network approach to
social mobility. Research in Social Stratification and Mobility, 2015,
41:56-65.
300 | I S I W S C 2 0 1 9