
Page 202 - Invited Paper Session (IPS) - Volume 1
P. 202
IPS131 Rivera-Galicia, L. F. et al.
4.3. The aggressors
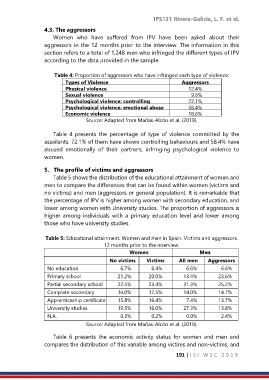
Women who have suffered from IPV have been asked about their
aggressors in the 12 months prior to the interview. The information in this
section refers to a total of 1,248 men who infringed the different types of IPV
according to the data provided in the sample.
Table 4: Proportion of aggressors who have infringed each type of violence:
Types of Violence Aggressors
Physical violence 12.4%
Sexual violence 9.6%
Psychological violence: controlling 72.1%
Psychological violence: emotional abuse 58.4%
behaviour
Economic violence 18.6%
Source: Adapted from Mañas-Alcón et al. (2019).
Table 4 presents the percentage of type of violence committed by the
assailants. 72.1% of them have shown controlling behaviours and 58.4% have
abused emotionally of their partners, infringing psychological violence to
women.
5. The profile of victims and aggressors
Table 5 shows the distribution of the educational attainment of women and
men to compare the differences that can be found within women (victims and
no victims) and men (aggressors or general population). It is remarkable that
the percentage of IPV is higher among women with secondary education, and
lower among women with University studies. The proportion of aggressors is
higher among individuals with a primary education level and lower among
those who have university studies.
Table 5: Educational attainment. Women and men in Spain. Victims and aggressors.
12 months prior to the interview.
Women Men
No victims Victims All men Aggressors
No education 6.7% 6.4% 6.6% 6.6%
Primary school 21.2% 20.0% 13.4% 23.6%
Partial secondary school 22.5% 23.4% 31.3% 25.2%
Complete secondary 14.0% 17,5% 14.0% 14.7%
school 15.8% 16.4% 7.4% 13.7%
Apprenticeship certificate
University studies 19.5% 16.0% 27.3% 13.8%
N.A. 0.3% 0.2% 0.0% 2.4%
Source: Adapted from Mañas-Alcón et al. (2019).
Table 6 presents the economic activity status for women and men and
compares the distribution of this variable among victims and non-victims, and
191 | I S I W S C 2 0 1 9