
Page 201 - Invited Paper Session (IPS) - Volume 1
P. 201
IPS131 Rivera-Galicia, L. F. et al.
49.1% of the population are males and 50.9% females. The Survey on
Violence against Women 2015 considers only women aged more than 15, so
the objective population is 84.7% of Spanish women. Women under 16 have
been discarded due to legal reasons (parental permission is needed). Thus,
sampling coverage is 43.1% of the Spanish population.
4.2. IPV against women
According to the data gathered from the Survey on Violence against
Women 2015, 13.2% of Spanish women aged 16 or more suffered any type of
IPV during the 12 months prior to the interview (1,339 women out of 10,171
women in the sample). The most common type of IPV suffered is psychological
violence, with controlling behaviour (9.2%), followed by emotional abuse
(7.9%) and physical and/or sexual violence (2.7%) (see Table 3):
Table 3: IPV suffered in the last 12 months (%).
Types of Violence Women 16 years old or
Any type of Violence more 13.2%
Physical violence 1.8%
Sexual violence 1.4%
Physical and/or sexual violence 2.7%
Psychological violence: controlling 9.2%
Psychological violence: emotional abuse 7.9%
behaviour
Economic violence 2.5%
Source: Mañas-Alcón et al. (2019).
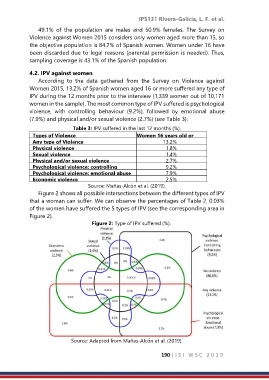
Figure 2 shows all possible intersections between the different types of IPV
that a woman can suffer. We can observe the percentages of Table 2. 0.03%
of the women have suffered the 5 types of IPV (see the corresponding area in
Figure 2).
Figure 2: Type of IPV suffered (%).
Source: Adapted from Mañas-Alcón et al. (2019).
190 | I S I W S C 2 0 1 9