
Page 248 - Invited Paper Session (IPS) - Volume 1
P. 248
IPS152 Paul F.
and holds approximately a similar amount of external assets (capital “in
transit”), thus generates balanced positions (i.i.p.), and transactions (b.o.p.-
7
financial accounts) . How to identify the networks, ie how to group together
Luxembourg affiliates of a single MNE?
The BCL’s main source for this task is internal: i.e. companies’ financial
statements and survey data. Yet Eurostat Enterprise Group Register (EGR) also
covers an increasing number of companies.
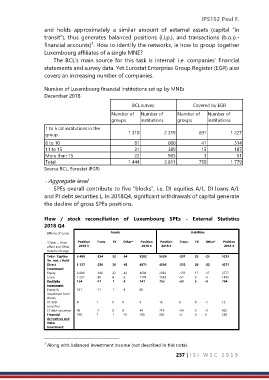
Number of Luxembourg financial institutions set up by MNEs
December 2018
BCL survey Covered by EGR
Number of Number of Number of Number of
groups institutions groups institutions
1 to 5 LU institutions in the
group 1 310 2 319 691 1 227
6 to 10 81 600 41 314
11 to 15 31 389 15 187
More than 15 22 503 3 51
Total 1 444 3 811 750 1 779
Source BCL, Eurostat (EGR)
- Aggregate level
SPEs overall contribute to five “blocks”, i.e. DI equities A/L, DI loans A/L
and PI debt securities L. In 2018Q4, significant withdrawals of capital generate
the decline of gross SPEs positions.
Flow / stock reconciliation of Luxembourg SPEs - External Statistics
2018 Q4
Billions of euros Assets Liabilities
*Other = Price Position Trans. FX Other* Position Position Trans. FX Other* Position
effect and Other 2018 3 2018 4 2018 3 2018 4
Volume Change
Total- Captive 5 488 -254 32 -64 5202 5524 -291 25 -25 5233
fin. Inst. / RoW
Direct 5 137 -250 30 -45 4871 4506 -233 20 -22 4271
investment
Equity 3 880 -166 22 -43 3694 2954 -176 17 -17 2777
Loans 1 257 -85 8 -2 1178 1553 -57 3 -5 1493
Portfolio 154 -11 1 -3 141 755 -53 5 -3 704
investment
Equity & 101 -11 1 -3 88
investment fund
shares
ST debt 8 1 0 0 9 13 0 0 -1 12
securities
LT debt securities 45 -1 0 0 44 714 -54 5 -3 662
Financial 198 7 1 -16 190 262 -4 0 0 258
derivatives and
Other
Investment
7 Along with balanced investment income (not described in this note).
237 | I S I W S C 2 0 1 9