
Page 357 - Special Topic Session (STS) - Volume 3
P. 357
STS550 Angelia L. Grant et al.
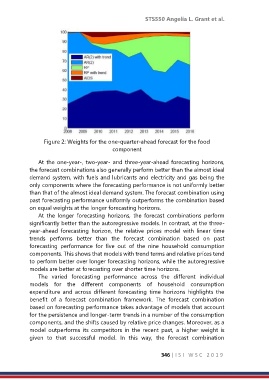
Figure 2: Weights for the one-quarter-ahead forecast for the food
component
At the one-year-, two-year- and three-year-ahead forecasting horizons,
the forecast combinations also generally perform better than the almost ideal
demand system, with fuels and lubricants and electricity and gas being the
only components where the forecasting performance is not uniformly better
than that of the almost ideal demand system. The forecast combination using
past forecasting performance uniformly outperforms the combination based
on equal weights at the longer forecasting horizons.
At the longer forecasting horizons, the forecast combinations perform
significantly better than the autoregressive models. In contrast, at the three-
year-ahead forecasting horizon, the relative prices model with linear time
trends performs better than the forecast combination based on past
forecasting performance for five out of the nine household consumption
components. This shows that models with trend terms and relative prices tend
to perform better over longer forecasting horizons, while the autoregressive
models are better at forecasting over shorter time horizons.
The varied forecasting performance across the different individual
models for the different components of household consumption
expenditure and across different forecasting time horizons highlights the
benefit of a forecast combination framework. The forecast combination
based on forecasting performance takes advantage of models that account
for the persistence and longer-term trends in a number of the consumption
components, and the shifts caused by relative price changes. Moreover, as a
model outperforms its competitors in the recent past, a higher weight is
given to that successful model. In this way, the forecast combination
346 | I S I W S C 2 0 1 9