Page 168 - Contributed Paper Session (CPS) - Volume 2
P. 168

CPS1494 Senthilvel V. et al.
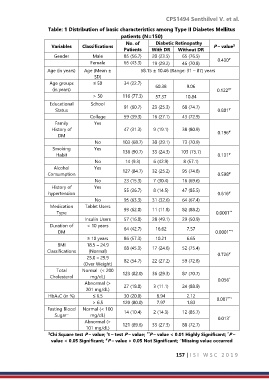
                   Table: 1 Distribution of basic characteristics among Type II Diabetes Mellitus
                                               patients (N=150)
                                                             Diabetic Retinopathy
                                                 No. of
                     Variables    Classifications   Patients   With DR   Without DR   P – value
                                                                                          $
                      Gender         Male        85 (56.7)   20 (23.5)   65 (76.5)   0.430
                                                                                         #
                                    Female       65 (43.3)   19 (29.2)   46 (70.8)
                   Age (in years)   Age (Mean ±        58.15 ± 10.46 (Range: 31 – 87) years
                                     SD)
                    Age groups       ≤ 50        34 (22.7)   60.38       9.06
                     (in years)                                                     0.122
                                                                                         #†
                                     > 50       116 (77.3)   57.37      10.84
                    Educational     School       91 (60.7)   23 (25.3)   68 (74.7)
                      Status                                                         0.801
                                                                                         #
                                    College      59 (39.3)   16 (27.1)   43 (72.9)
                      Family         Yes
                     History of                  47 (31.3)   9 (19.1)   38 (80.9)    0.196
                                                                                         #
                       DM
                                     No         103 (68.7)   30 (29.1)   73 (70.9)
                     Smoking         Yes        136 (90.7)   33 (24.3)   103 (75.7)
                       Habit                                                         0.131
                                                                                         #
                                     No          14 (9.3)   6 (42.9)   8 (57.1)
                      Alcohol        Yes
                   Consumption                  127 (84.7)   32 (25.2)   95 (74.8)   0.598
                                                                                         #
                                     No          23 (15.3)   7 (30.4)   16 (69.6)
                     History of      Yes
                   hypertension                  55 (36.7)   8 (14.5)   47 (85.5)    0.616
                                                                                         #
                                     No          95 (63.3)   31 (32.6)   64 (67.4)
                    Medication    Tablet Users   93 (62.0)   11 (11.8)   82 (88.2)
                       Type                                                         0.0001
                                                                                         **
                                  Insulin Users   57 (16.0)   28 (49.1)   29 (50.9)
                    Duration of   < 10 years     64 (42.7)   16.62       7.57
                       DM                                                           0.0001
                                                                                         **†
                                   ≥ 10 years    86 (57.3)   10.21       6.65
                       BMI        18.5 – 24.9
                   Classifications     (Normal)   68 (45.3)   17 (24.6)   52 (75.4)   0.726
                                                                                         #
                                  25.0 – 29.9    82 (54.7)   22 (27.2)   59 (72.8)
                                 (Over Weight)
                       Total     Normal  (< 200
                    Cholesterol     mg/dL)      123 (82.0)   36 (29.3)   87 (70.7)   0.056
                                                                                         *
                                  Abnormal (>    27 (18.0)   3 (11.1)   24 (88.9)
                                  201 mg/dL)
                    HbA 1C (in %)    ≤ 6.5       30 (20.0)   8.94        2.12       0.007
                                                                                        **†
                                     > 6.5      120 (80.0)   7.97        1.83
                   Fasting Blood   Normal (< 100   14 (10.4)   2 (14.3)   12 (85.7)
                           ~
                      Sugar         mg/dL)                                               *
                                  Abnormal (>   121 (89.6)   33 (27.3)   88 (72.7)   0.013
                                  101 mg/dL)
                                                                                        *
                    $ Chi Square test P – value;  t – test P – value;  P – value < 0.01 Highly Significant;  P –
                                                         **
                                          †
                                          #
                     value < 0.05 Significant;  P – value > 0.05 Not Significant;  Missing value occurred
                                                                      ~

                                                                     157 | I S I   W S C   2 0 1 9
   163   164   165   166   167   168   169   170   171   172   173